
Table of Contents
1. What is the Graph Coloring Problem?
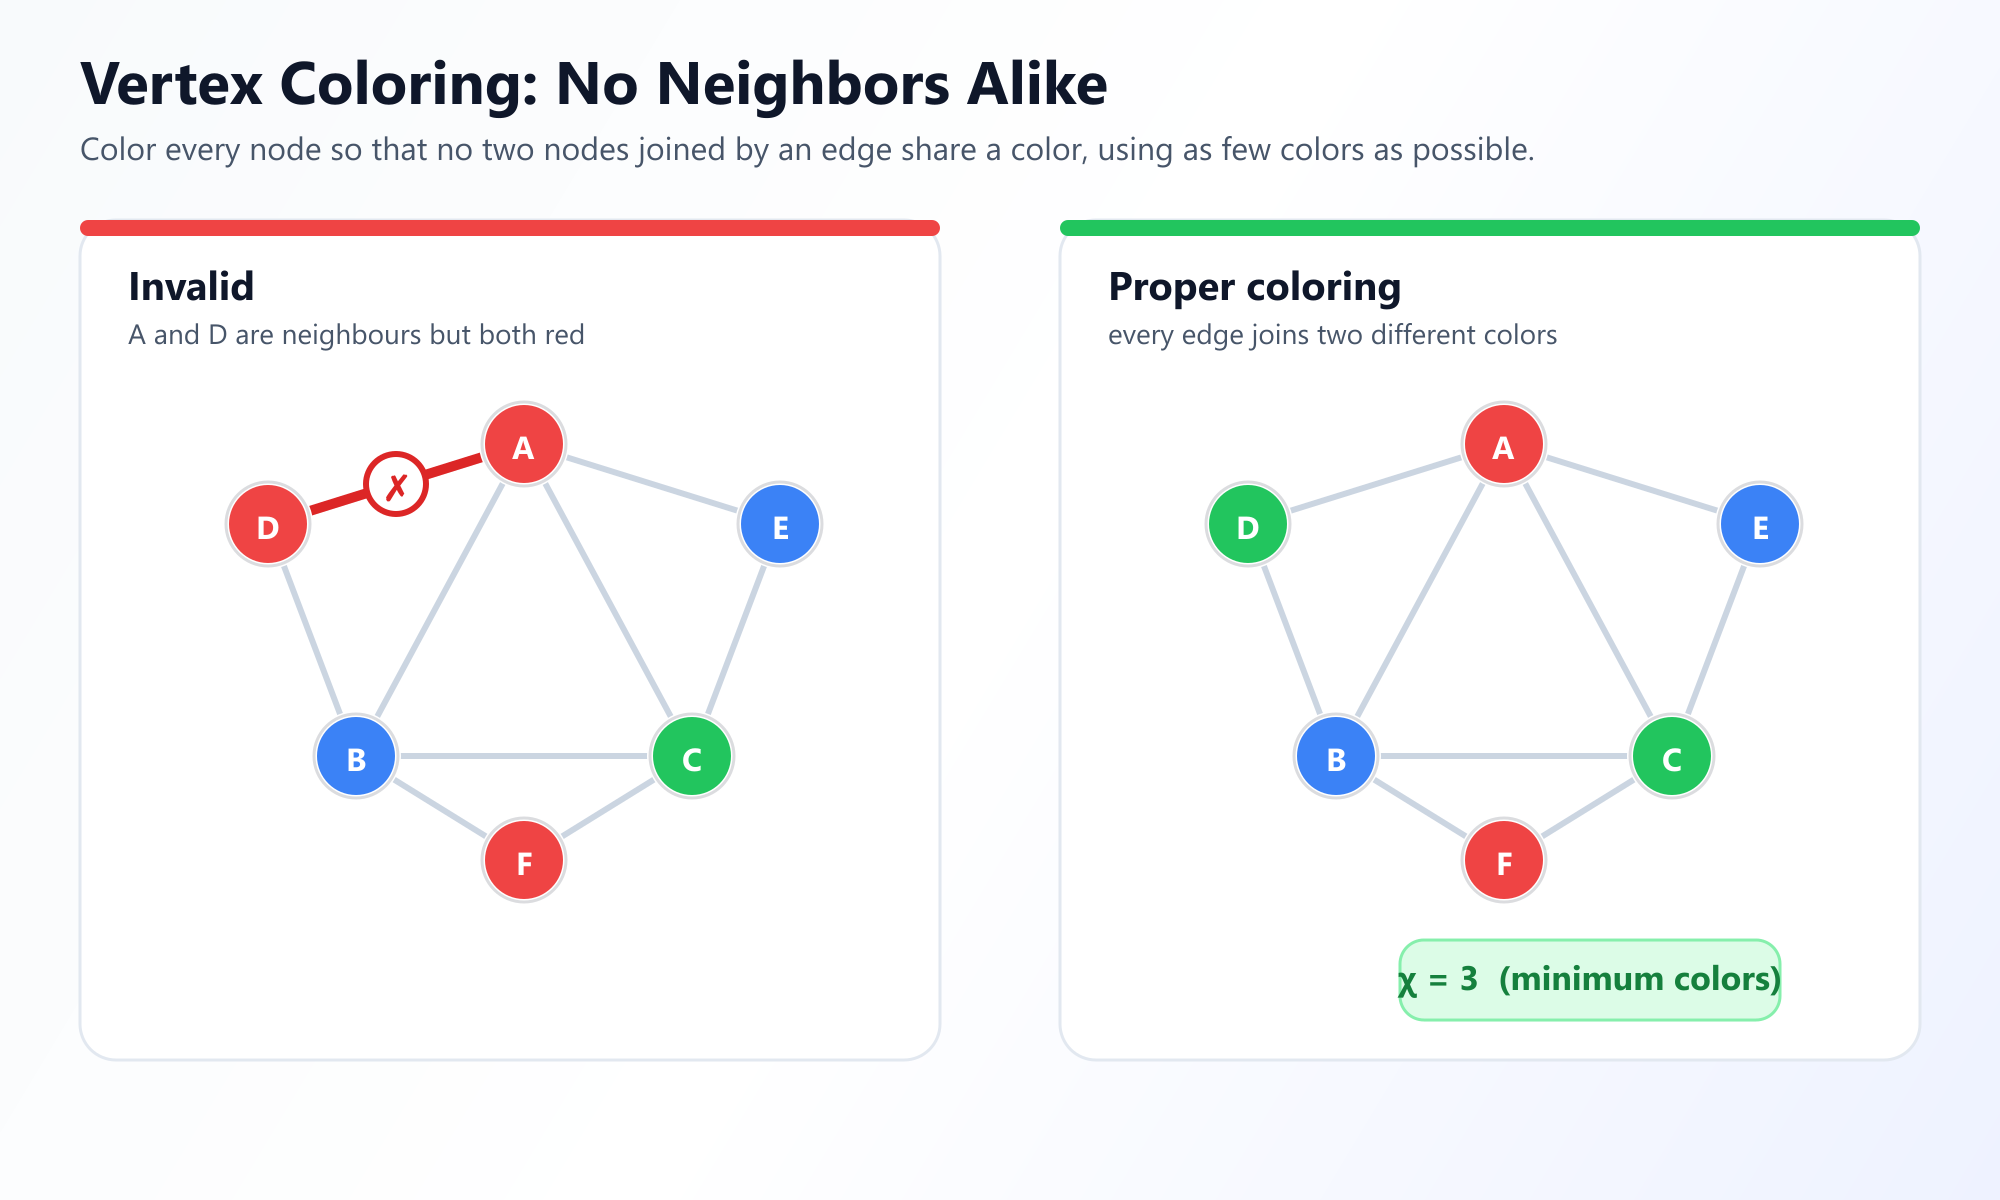
Graph coloring is exactly what it sounds like: assigning colors to certain elements of a graph subject to specific constraints. By far the most common type of graph coloring is Vertex Coloring.
The rules of Vertex Coloring are remarkably simple:
- You must assign a color to every vertex (node) in the graph.
- No two adjacent vertices can share the same color. If there is an edge connecting Node A to Node B, they must be different colors.
- The goal is to use the absolute minimum number of colors possible.
While the rules are simple enough for a child to understand, finding the minimum number of colors for a large, complex graph is incredibly difficult. In fact, finding the exact minimum is an NP-Complete problem, meaning there is no known fast algorithm to solve it perfectly for all graphs.
2. The Chromatic Number (and Bipartite Graphs)
The absolute minimum number of colors needed to color a specific graph is called its Chromatic Number, usually denoted by the Greek letter Chi χ(G).
Let's look at a few examples to understand chromatic numbers:
- A Graph with no edges: You can color every node the same color.
χ = 1. - A Triangle (Complete Graph K3): Every node connects to every other node. Node A is Red, Node B must be Blue, and Node C must be Green.
χ = 3. - A Star Graph: One central node connected to many outer nodes. The center is Red. Because the outer nodes don't connect to each other, they can all be Blue.
χ = 2.
Bipartite Graphs
Any graph that can be colored using exactly two colors (χ = 2) is called a Bipartite Graph. This is a massive concept in graph theory. If a graph is bipartite, you can split its vertices into two distinct sets (like "Red nodes" and "Blue nodes") where edges only ever cross between the sets, never within them. If a graph contains a cycle with an odd number of nodes (like a triangle), it can never be bipartite.
3. The Famous Four Color Theorem
Historically, graph coloring originated from mapmaking. In 1852, Francis Guthrie was trying to color a map of the counties of England and noticed that he only needed four colors to ensure that no two bordering counties shared a color. He asked his brother, a mathematician, if this was a universal rule.
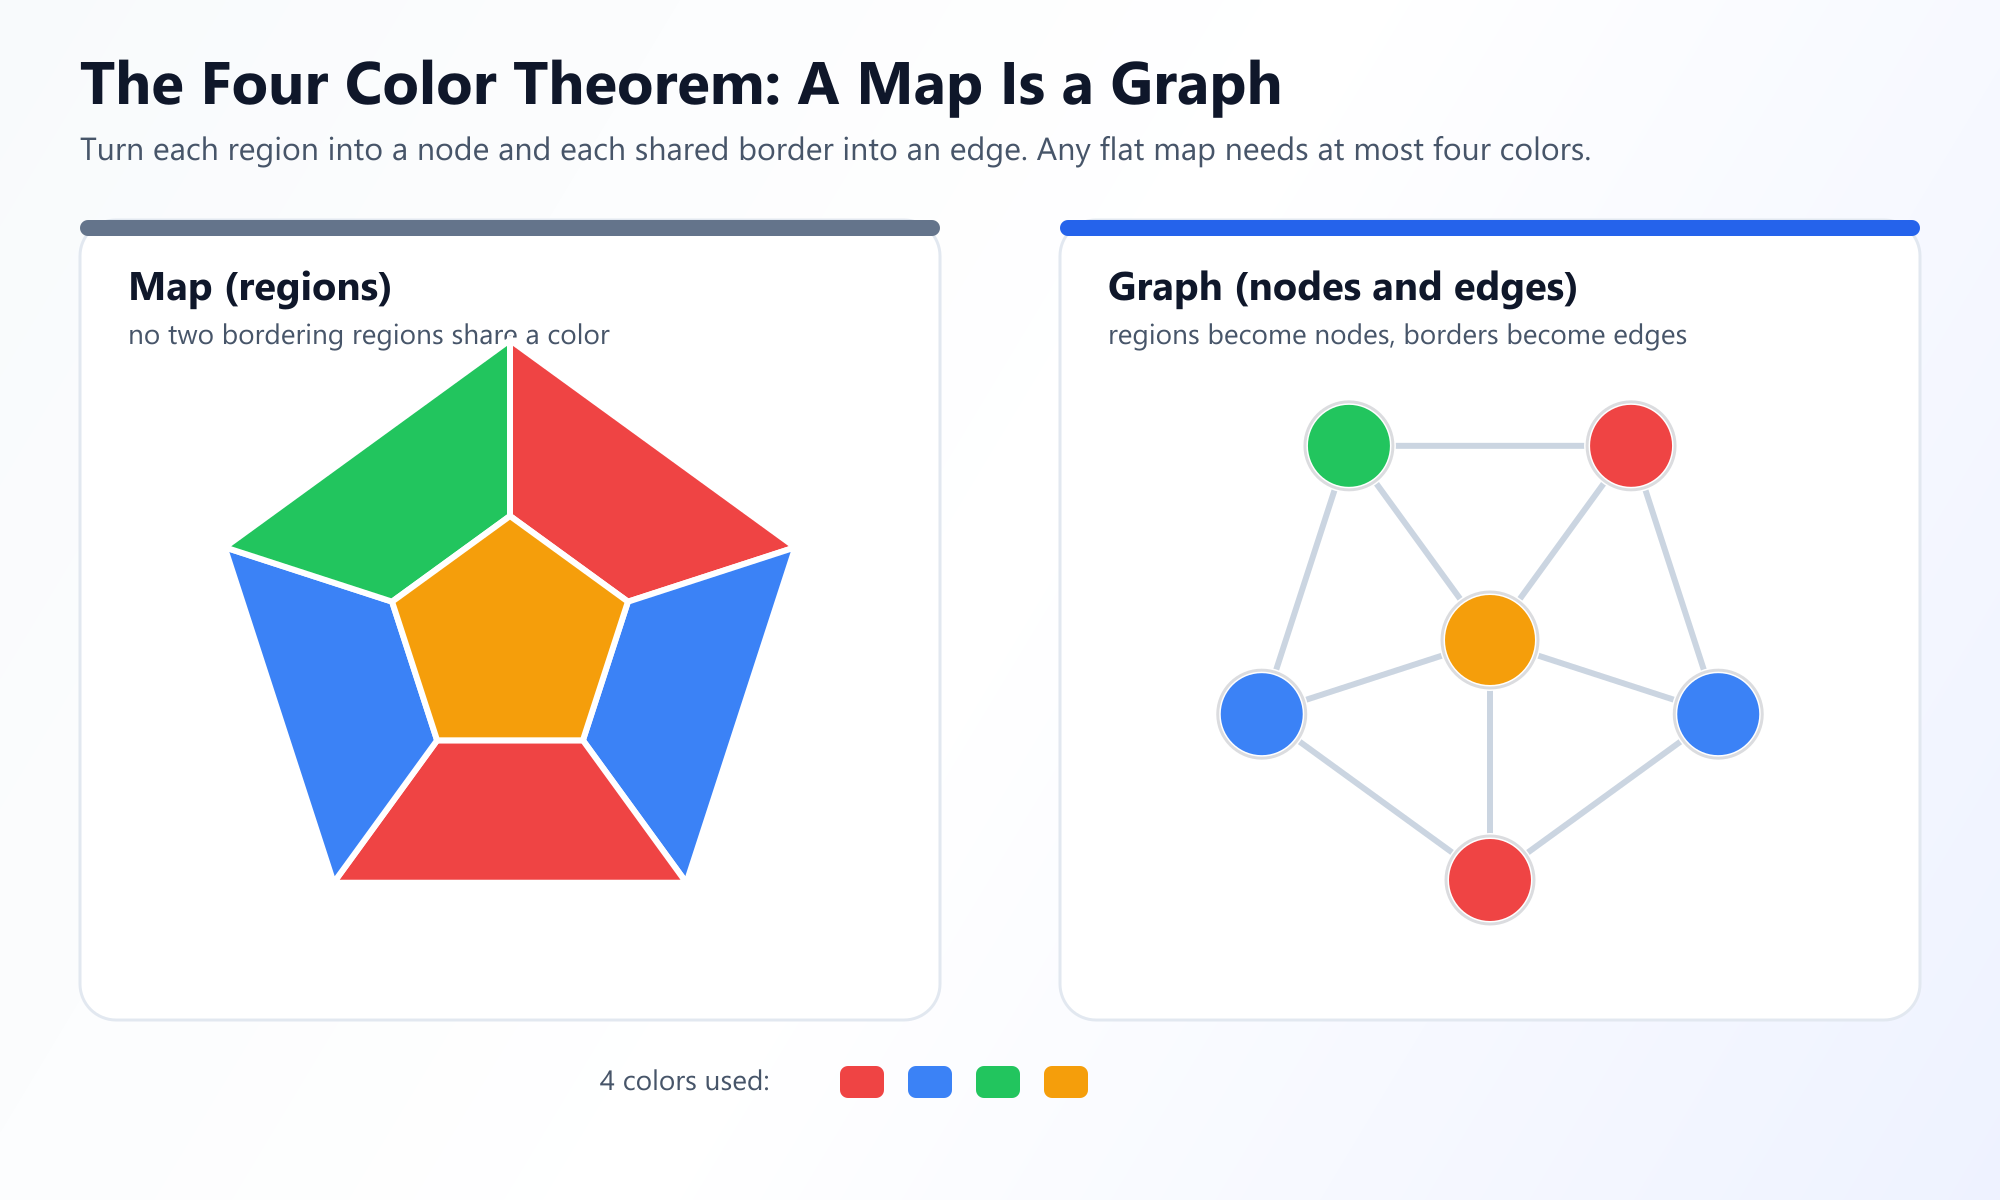
This became the Four Color Problem: Given any separation of a plane into contiguous regions, producing a figure called a map, no more than four colors are required to color the regions of the map so that no two adjacent regions have the same color.
To view a map as a graph, you simply treat each country as a Node, and draw an Edge between two countries if they share a border. The theorem states that any planar graph (a graph that can be drawn on a flat piece of paper without any edges crossing) has a chromatic number of at most 4.
It took over a century to prove. In 1976, Kenneth Appel and Wolfgang Haken finally proved the Four Color Theorem using a computer program to check 1,936 specific configurations. It was the first major mathematical theorem to be proved using a computer, causing massive philosophical debates among mathematicians at the time.
Interactive Graph Coloring
Try to manually color a complex graph using the fewest colors possible, or watch the Greedy Algorithm do it instantly. Can you find a graph that requires 5 colors?
Launch the Coloring Visualizer4. How to Color a Graph (Algorithms)
Because finding the perfect chromatic number is NP-Complete, we rarely try to find the perfect solution in software engineering. Instead, we use heuristics to find a good solution very quickly.
The Greedy Algorithm
The simplest approach is the Greedy Algorithm. It doesn't guarantee the absolute minimum number of colors, but it guarantees it will never use more colors than the maximum degree of a vertex plus one (d + 1).
- Order the vertices of the graph (V1, V2, ... Vn).
- Assign the first available color (Color 1) to the first vertex (V1).
- For every subsequent vertex, look at all its previously colored neighbors.
- Assign the current vertex the lowest numbered color that is not currently used by any of its neighbors.
- If all previously used colors are taken by neighbors, introduce a new color.
The Catch: The number of colors the Greedy Algorithm uses heavily depends on the order of the vertices. If you order them poorly, it uses too many colors. This led to the Welsh-Powell Algorithm, which simply says: Sort the vertices in descending order based on their degree (number of connections) before running the Greedy Algorithm. This small tweak yields drastically better results.
5. Real-World Applications
Graph coloring isn't just about making pretty maps. It solves massive logistical problems.
1. Scheduling Conflicts (Exams and Taxis)
Imagine you are scheduling final exams for a university. You have hundreds of classes, and many students take multiple classes. If two classes share a student, their exams cannot be scheduled at the same time.
- Nodes: The classes.
- Edges: Connect two classes if they share at least one student.
- Colors: The time slots.
By coloring the graph, you find the minimum number of time slots needed to schedule all exams without any student having a conflict.
2. Compiler Register Allocation
When a compiler translates your code (like C++ or Rust) into machine code, it has to assign your variables to the CPU's hardware registers. CPUs only have a tiny number of registers (e.g., 16 or 32). If two variables are used at the same time in your code, they cannot be stored in the same register.
Compilers build an "interference graph" where variables are nodes, and edges connect variables whose lifespans overlap. Coloring the graph assigns variables to registers. If the chromatic number is higher than the available CPU registers, the compiler is forced to "spill" variables to the slower RAM.
3. Frequency Assignment
Cell phone towers transmit signals on specific frequencies. If two towers are too close to each other, they cannot use the same frequency or they will cause interference.
By representing towers as nodes and drawing edges between towers that overlap geographically, telecom companies use graph coloring to assign frequencies (colors) to towers using the minimum amount of bandwidth possible.
6. Why Sudoku is Just a Graph Coloring Puzzle
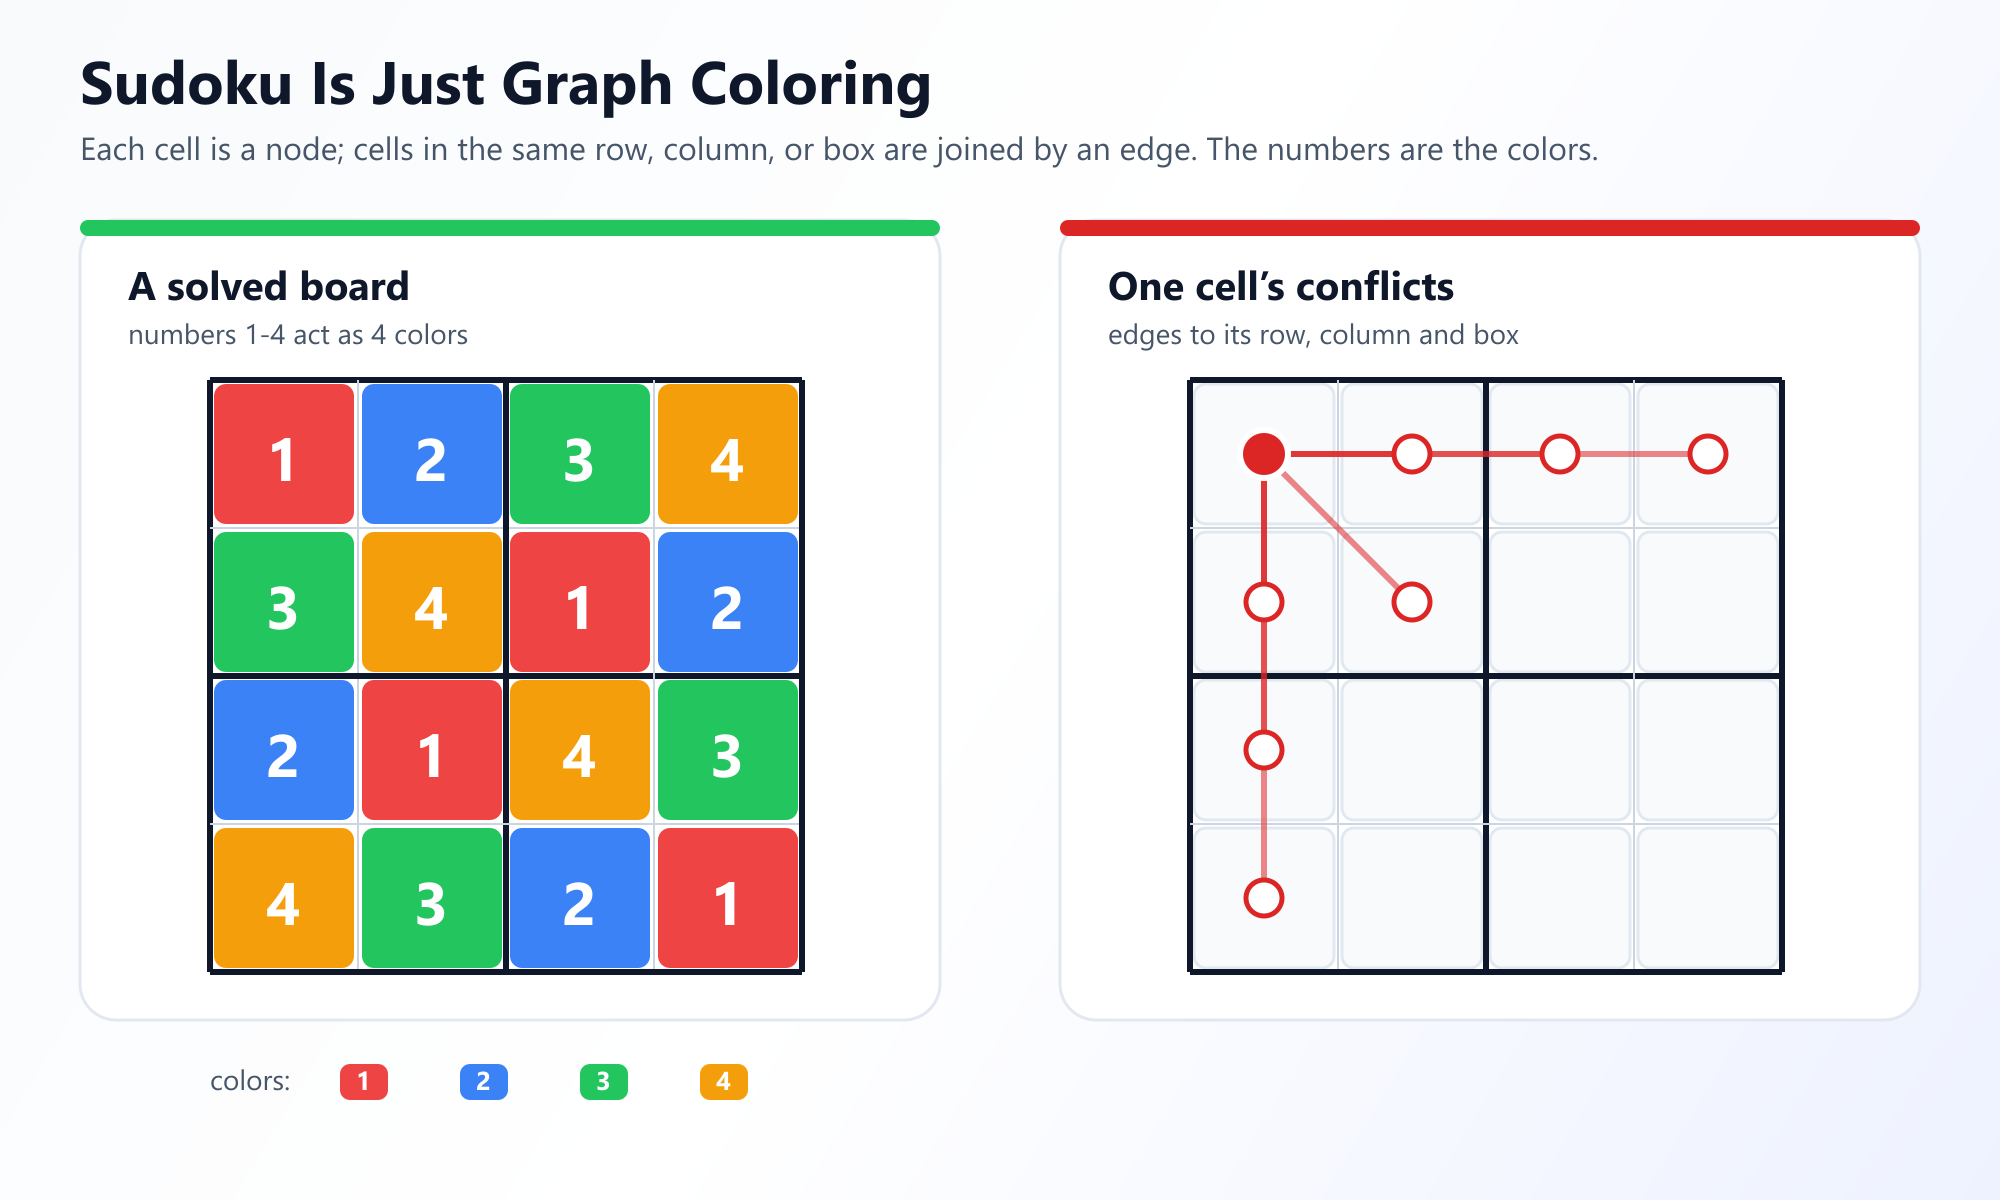
If you've ever played Sudoku, you've been solving a Graph Coloring problem.
In a standard 9x9 Sudoku board, there are 81 squares. You must fill them with numbers 1-9 such that no row, column, or 3x3 block contains a duplicate number.
To convert this to a graph:
- Create 81 Nodes (one for each square).
- Draw an Edge between any two nodes if they share the same row, the same column, or the same 3x3 block.
- The pre-filled numbers are nodes that are already "colored."
- You have exactly 9 Colors (the numbers 1 through 9) to color the rest of the graph.
Writing a Sudoku solver using a Graph Coloring algorithm with backtracking is a classic computer science assignment and highlights the incredible versatility of graph theory.
Frequently Asked Questions
What is vertex coloring in graph theory?
Vertex coloring is the assignment of colors to each vertex in a graph such that no two adjacent vertices (connected by an edge) share the same color.
What is the chromatic number of a graph?
The chromatic number (χ) is the minimum number of colors needed to color a graph properly. For example, a bipartite graph has a chromatic number of 2.
What is the complexity of solving the graph coloring problem?
Finding the chromatic number of a general graph is NP-complete, meaning there is no known polynomial-time algorithm to solve it exactly. Heuristics like the Greedy algorithm are used in practice.