
Table of Contents
- 1. Why a schedule is a graph
- 2. Activities, dependencies, and the four link types
- 3. The project used throughout this article
- 4. Is the plan even possible?
- 5. The critical path: two passes over the graph
- 6. Float, and who really owns it
- 7. The critical path is not always critical
- 8. PERT: putting a probability on the date
- 9. The merge bias: why PERT is optimistic
- 10. Crashing: buying time is a minimum cut
- 11. Resources: where the theory stops being enough
- 12. Critical chain, briefly
- 13. What is easy, what is hard
- 14. Modelling mistakes and how to avoid them
- 15. Frequently asked questions
- 16. References
1. Why a schedule is a graph
Every project plan makes the same two kinds of statement. The first is about work: this task takes nine days. The second is about order: this task cannot start until that one has finished. Write down a hundred of each and you have not written a list, you have written a graph. The tasks are the vertices, the ordering constraints are the directed edges, and the durations are weights.
This is not a way of looking at project plans. It is what a project plan is, and recognising it changes what you can ask. A list of tasks can tell you how much work there is. Only the graph can tell you how long the project takes, which is a different number and usually a much larger one, because work that cannot be done in parallel has to be done in sequence.
The consequences are immediate and slightly surprising. The duration of a project is not the sum of its task durations and it is not the largest one either. It is the length of the longest path through the network, which is why the project in this article holds seventy-two days of work and still finishes in thirty-nine. It is also why adding people does not automatically help, why the task everyone is worried about is often not the one that matters, and why a plan can be internally contradictory in a way that no amount of effort will fix.
The techniques in this article were invented within a year of each other, both under commercial and military pressure, and both by people who understood they were solving a graph problem. In 1959 James Kelley at Remington Rand and Morgan Walker at DuPont published the critical path method, developed to schedule the shutdown and restart of chemical plants, where every idle day cost real money. In the same year the US Navy's Special Projects Office published PERT, built to manage the Polaris missile programme, where the problem was not cost but the sheer uncertainty of work nobody had done before. Both papers describe activity networks, and both compute the longest path.
What follows builds one small project explicitly, thirteen activities with real durations, and answers every standard scheduling question on it: how long, what is critical, what can slip, how confident we are in the date, what it costs to go faster, and what happens when there are not enough people. Every number was computed, and every result was recomputed by a second method before it was written down.
2. Activities, dependencies, and the four link types
There are two conventions for drawing a project as a graph, and it is worth knowing both because the older one still appears in textbooks.
In activity-on-node (AoN), each activity is a vertex and each arrow is a dependency. This is what modern software uses and what this article uses throughout. In activity-on-arrow (AoA), each activity is an arrow and the vertices are events, the moments when a set of activities has completed. AoA was the original PERT and CPM convention, and it has one genuine drawback: expressing certain dependency patterns requires inserting dummy activities of zero duration, which exist only to get the logic right. AoN needs no dummies, which is one reason it displaced AoA in practice.
The dependency itself is not always the simple one. Four link types are standard:
- Finish to start (FS): B cannot start until A finishes. The default, and the only type used in this article.
- Start to start (SS): B cannot start until A has started. Useful for work that runs alongside, such as documentation trailing development by a few days.
- Finish to finish (FF): B cannot finish until A finishes.
- Start to finish (SF): B cannot finish until A has started. Rare, and usually a sign that the plan means something else.
Links can also carry a lag, a delay applied to the constraint: concrete needs to cure for three days before anything is built on it, so the edge carries a lag of three even though nobody is working. Lags are edge weights, and everything in this article works with them unchanged. A negative lag, called a lead, lets an activity start before its predecessor finishes; it is legal, and it is also a common way to build a plan that cannot actually be executed.
One rule matters more than all of this: the graph must be acyclic. If A waits for B and B waits for A, no order exists, and section 4 shows exactly what that looks like when a scheduler hits it.
3. The project used throughout this article
The example is a mobile product launch: thirteen activities, sixteen dependencies, durations in working days. It is small enough to check by hand and structured enough to show everything that matters, in particular several paths of nearly the same length, which is where most of the interesting behaviour lives.
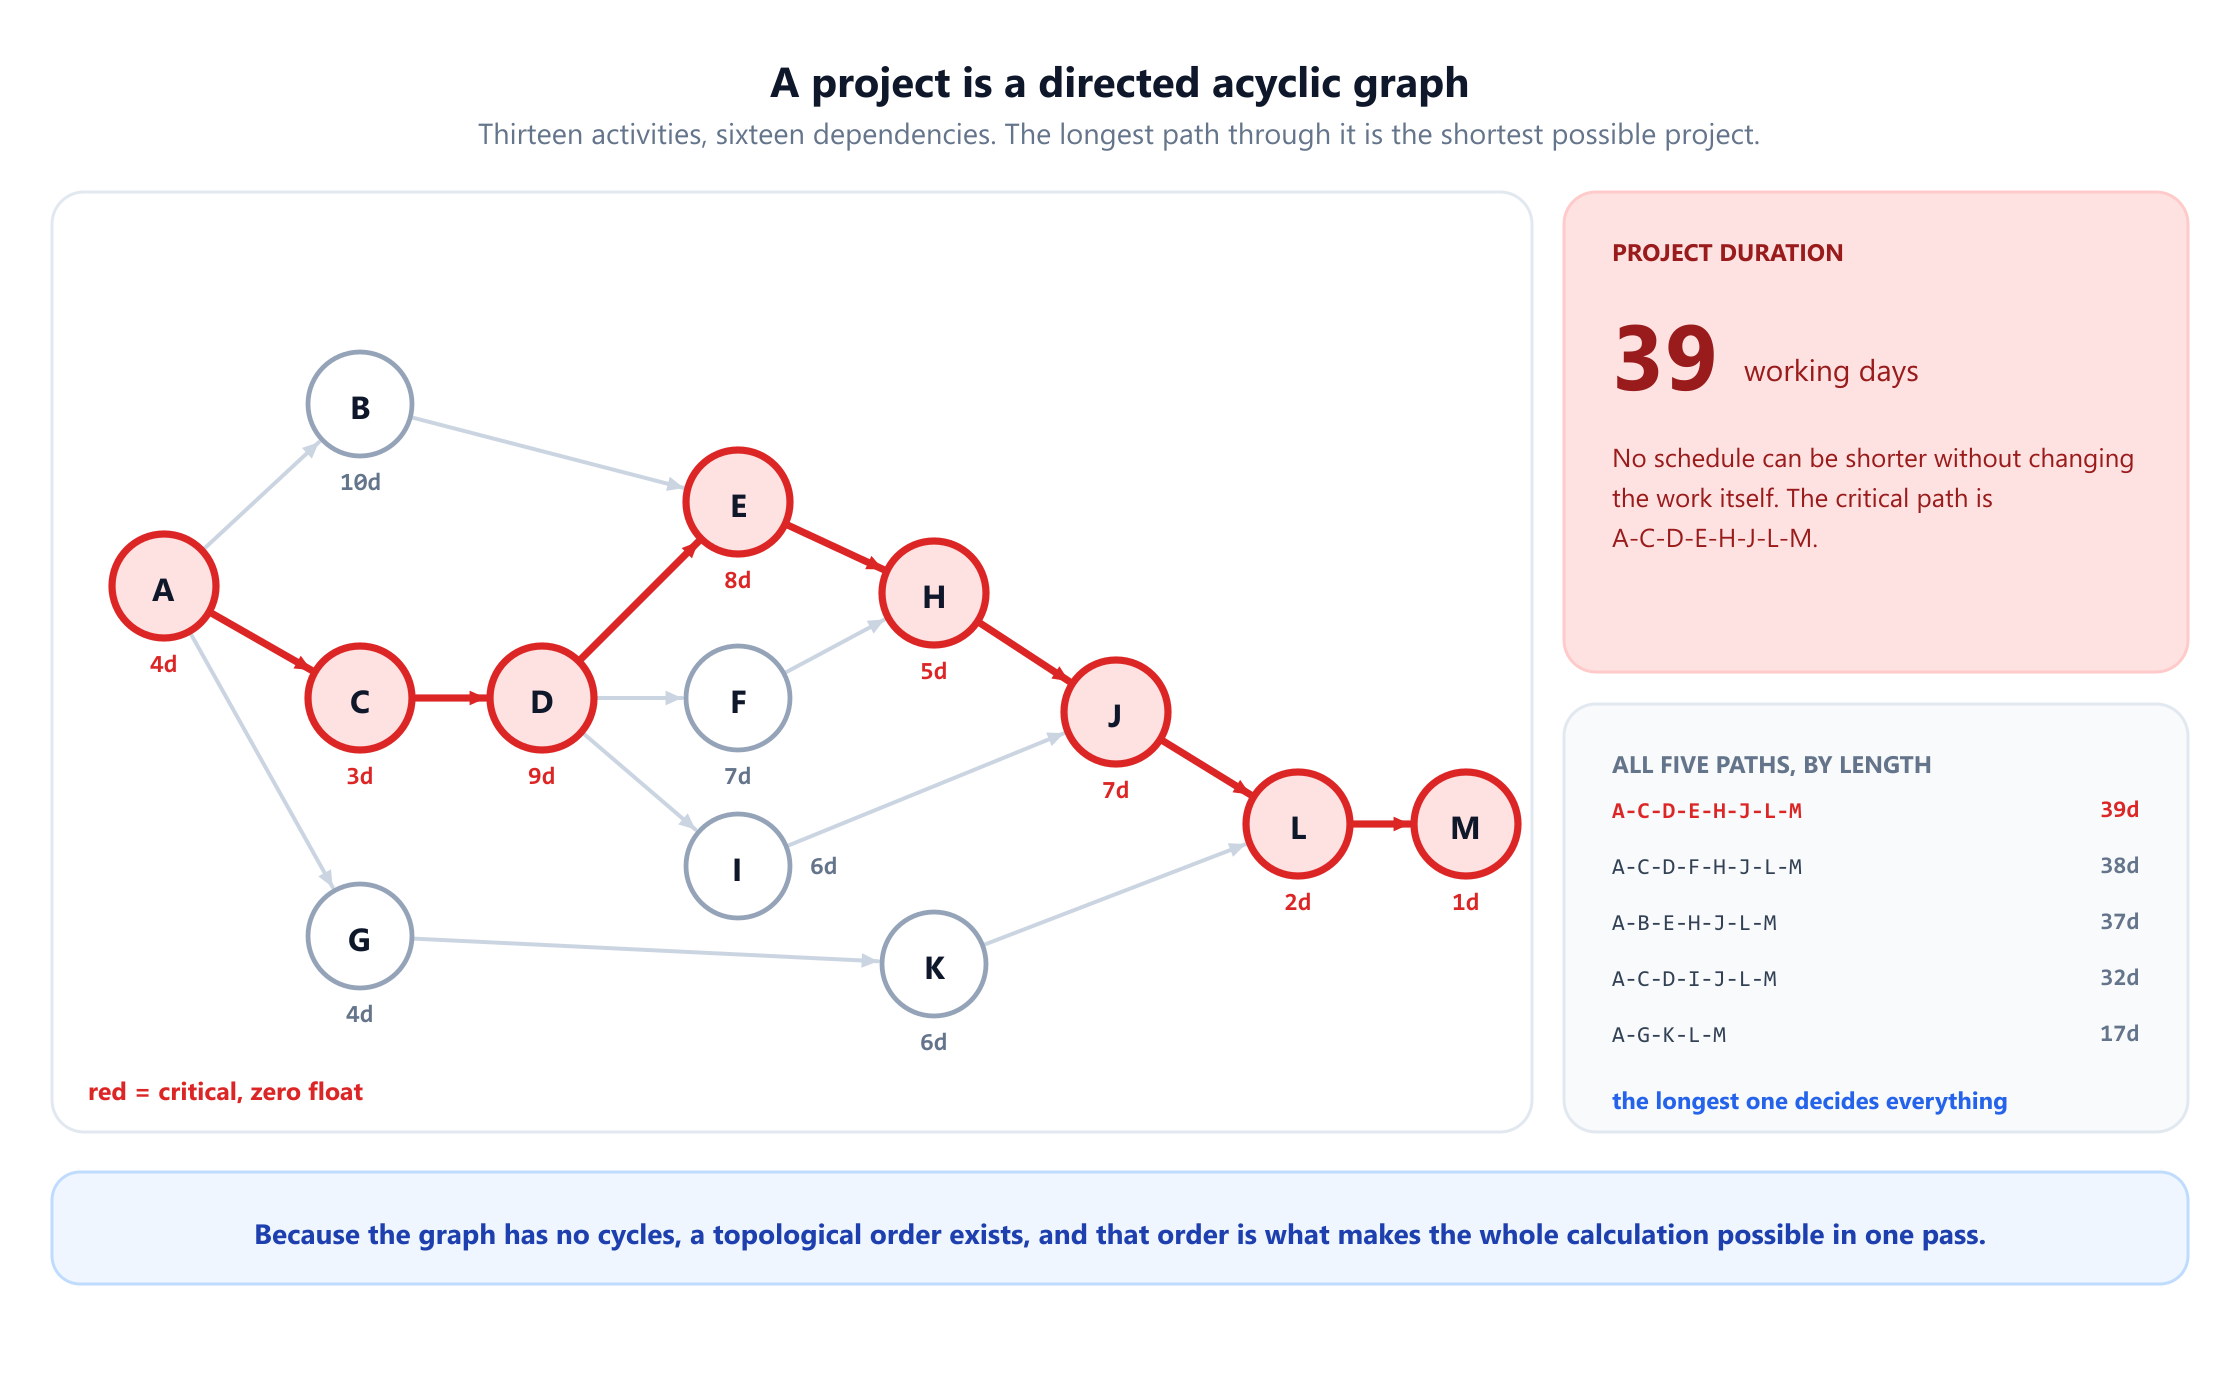
Read the structure rather than the labels. Requirements (A) opens three parallel streams: the product build through the database schema (C), the design work (B), and the marketing work (G). The build stream splits again after the backend API (D) into the frontend (E), payments (F) and the security review (I), then merges twice, first at integration testing (H) and again at the beta programme (J). Marketing rejoins only at submission (L).
Those merge points are where the difficulty concentrates. An activity with several predecessors waits for the slowest of them, and "slowest" is not fixed in advance when the durations are uncertain. Sections 9 and 11 are both, at bottom, about what happens at a merge.
4. Is the plan even possible?
Before asking how long a project takes, ask whether it can be done at all. A precedence network describes a valid plan only if it is a directed acyclic graph. If the dependencies contain a cycle, there is no order in which the work can be performed, and the plan is not late, it is impossible.
The test is a topological sort, and Kahn's algorithm is the version worth knowing because its failure mode is so informative. Repeatedly take any activity with no unfinished predecessors, output it, and remove it. On this project that produces the order A, B, C, D, E, F, G, H, I, J, K, L, M, all thirteen activities, so the plan is schedulable.
Now suppose someone adds a single reasonable-sounding dependency: the database schema (C) should not be finalised until integration testing (H) has revealed the real query patterns. Add the edge H to C and rerun. Kahn's algorithm outputs four activities and then stops: A, B, G and K, the only work not caught in the loop. The remaining nine are jammed, each waiting on another. The algorithm does not merely fail; the set it could not output is the deadlock, which is precisely the diagnostic a planner needs.
This matters in practice because real plans are assembled by many people, each adding locally sensible constraints, and nobody holds the whole graph in their head. Circular dependencies are common, and the graph finds them in linear time.
The topological order does more than validate the plan. Because it guarantees every predecessor appears before its successors, it lets the entire schedule be computed in a single pass over the activities, with no iteration and no search. That is why the critical path method is fast enough to have been practical on 1959 hardware, and why it remains instant on projects with a hundred thousand tasks.
5. The critical path: two passes over the graph
The critical path method computes four numbers for every activity and derives everything else from them.
The forward pass walks the activities in topological order and computes how early each one can happen. The earliest start of an activity is the latest of the earliest finishes of its predecessors, and its earliest finish is that plus its duration. Requirements starts at day 0 and finishes at day 4. The database schema then starts at 4 and finishes at 7. The backend API starts at 7 and finishes at 16. The frontend build waits for both the API (finishing at 16) and the UI design (finishing at 14), so it starts at 16, not 14. After one pass, the largest earliest finish is the project duration: 39 working days.
The backward pass walks the same order in reverse and computes how late each activity can happen without pushing the end date. The latest finish of an activity is the earliest of the latest starts of its successors. Launch must finish at 39, so it must start at 38; submission must finish by 38, so it starts at 36; and so on back to the beginning.
The gap between the two is total float, the amount an activity can slip before the project end moves. Activities with zero float form the critical path.
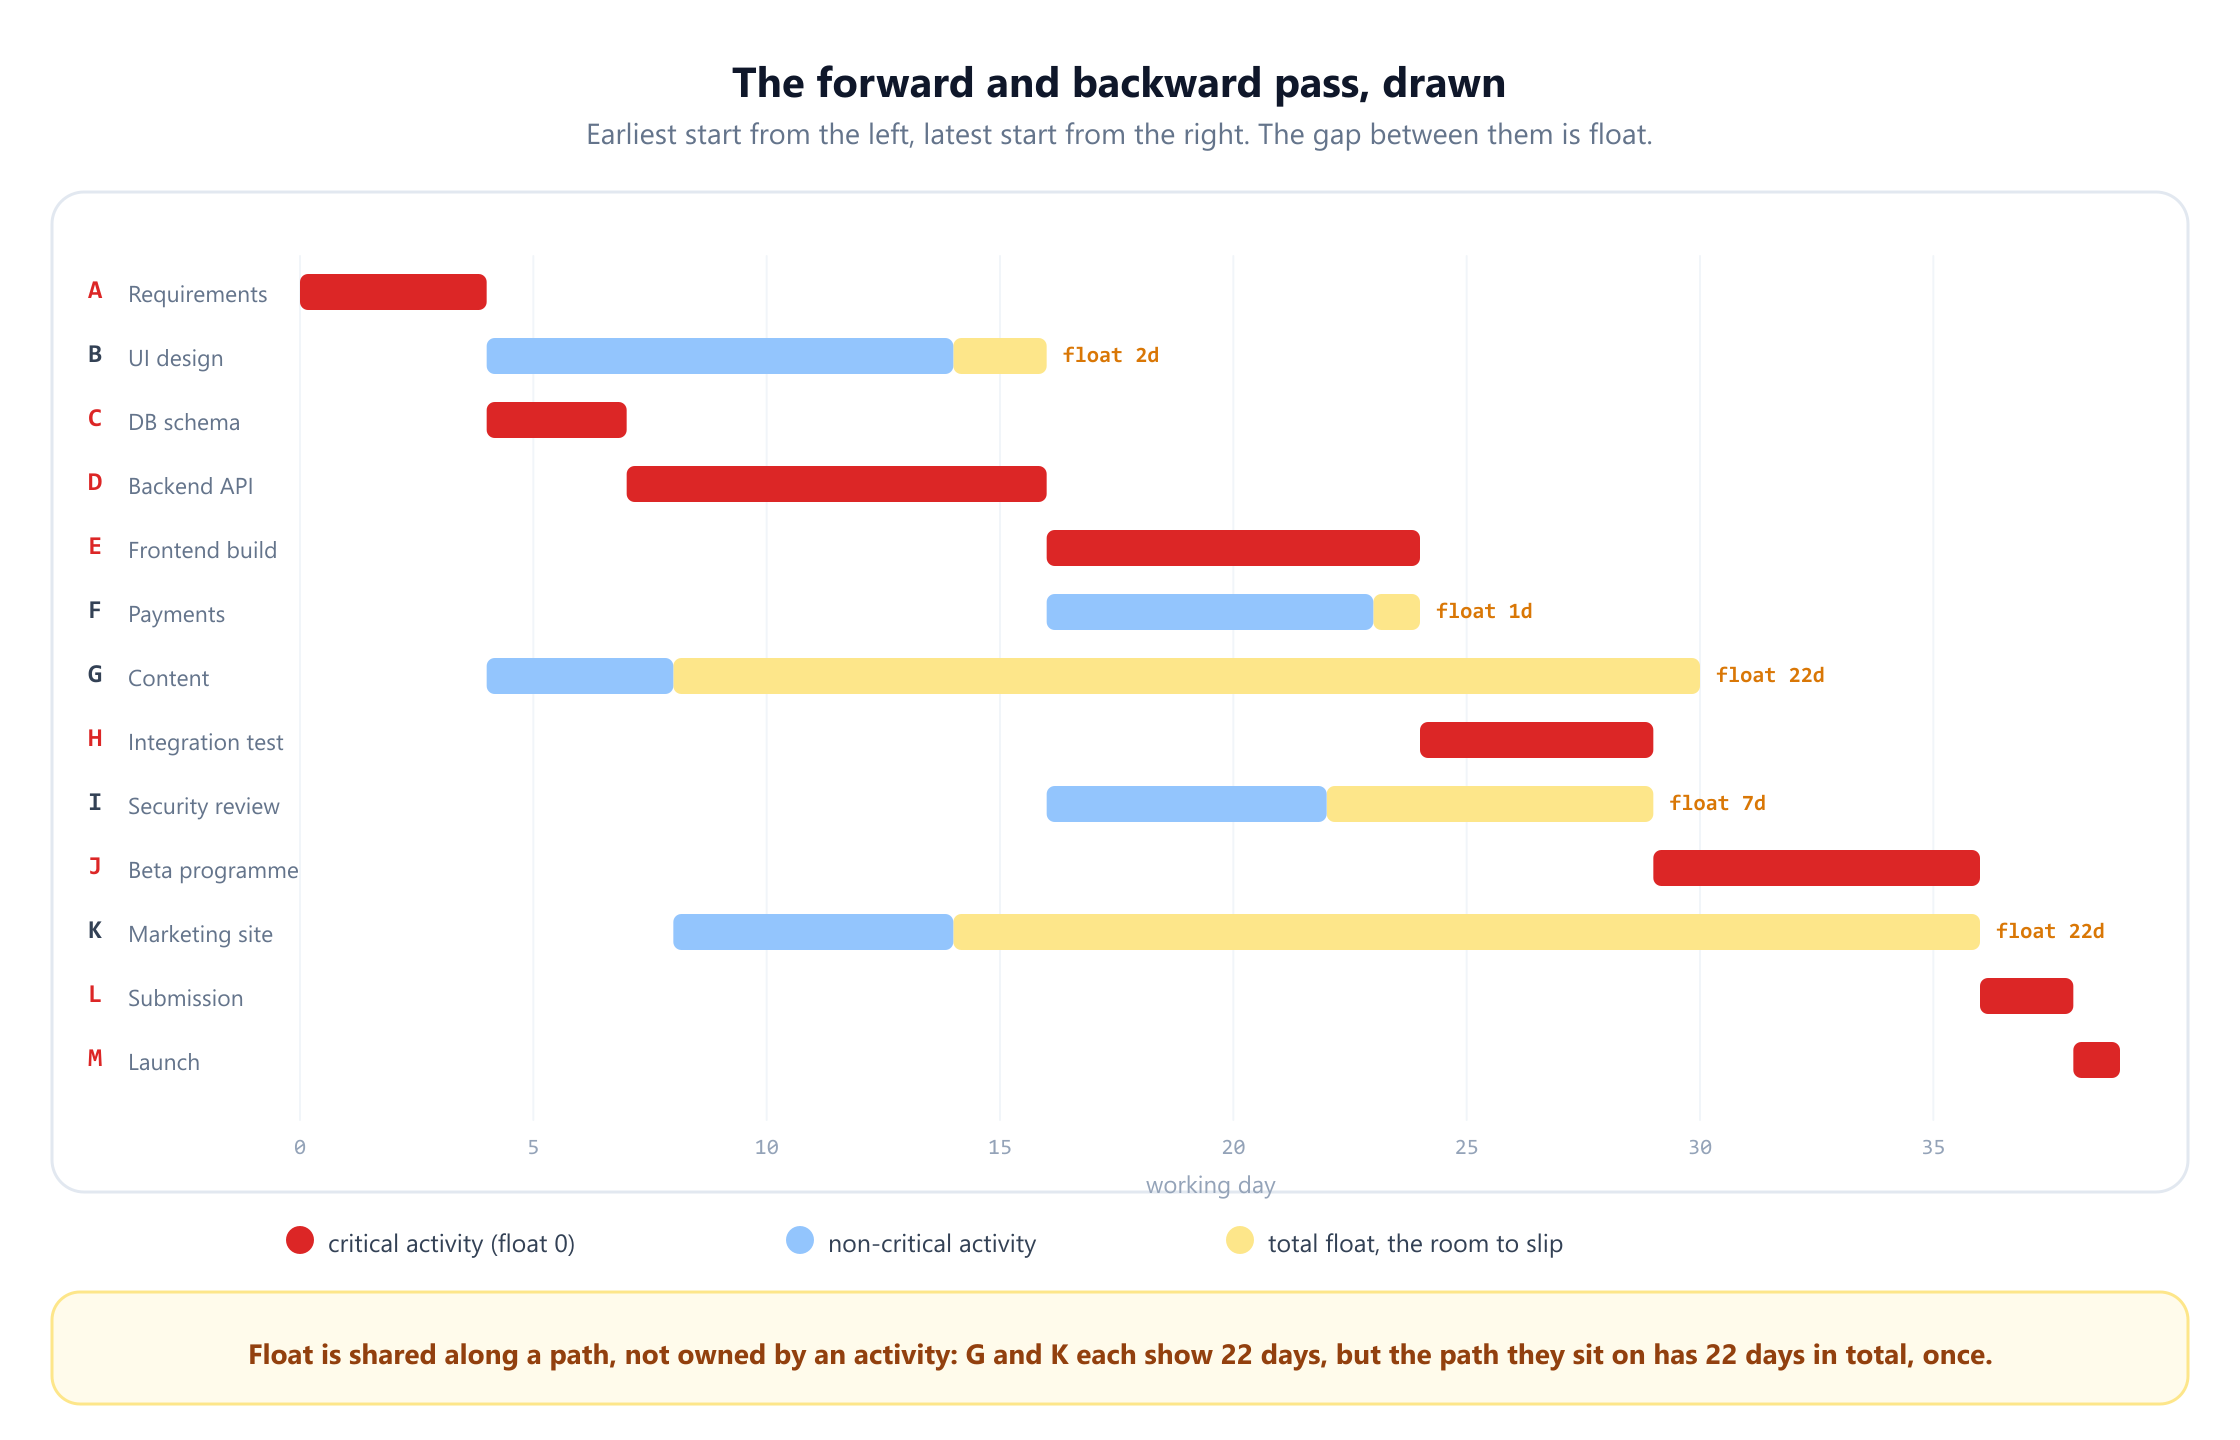
The critical path is A → C → D → E → H → J → L → M, and its length is exactly the 39 days the forward pass produced. That is not a coincidence but a theorem: the project duration equals the length of the longest path, and the activities with zero float are exactly those lying on a longest path. When two paths tie for longest, as happens in section 10, both of them are critical.
Two things follow that are worth stating plainly. First, delaying any critical activity by one day delays the project by one day, with no exceptions and no absorption. Second, speeding up a non-critical activity does nothing at all to the end date. The marketing site could be finished in a single day and the launch would still be on day 39. Effort spent off the critical path buys safety margin, not time.
You can run these two passes step by step on a network you draw yourself in the critical path method visualizer. It is worth noticing what CPM is, mathematically. Finding a longest path is NP-hard in a general graph, because you could use it to solve the Hamiltonian path problem. On a directed acyclic graph it becomes easy, linear in the number of activities and dependencies, precisely because a topological order exists. The entire practical value of CPM rests on the acyclicity that section 4 checked.
6. Float, and who really owns it
Float is the most useful number in a schedule and the most consistently misused. The confusion comes from there being two kinds of it.
Total float is how long an activity can be delayed without pushing the project end date. Free float is how long it can be delayed without pushing the earliest start of any of its successors. In this project the security review (I) has 7 days of total float and 7 days of free float, because the beta programme it feeds is waiting on integration testing anyway. Content (G) has 22 days of total float but zero free float: delay it by even one day and the marketing site starts a day later.
That difference is exactly the trap. Content and the marketing site each show 22 days of total float, and a manager reading the schedule row by row sees 44 days of apparent slack. There are 22. The float belongs to the path A → G → K → L → M, which runs 17 days inside a 39-day project, and the two activities share it.
The model makes this concrete. Spend the whole 22 days on content, and the project still finishes on day 39, but the marketing site's total float falls from 22 to zero: it has become critical. Delay it one further day and the project moves to 40. Nothing was overrun, nothing went wrong on any single task, and the date slipped, because the slack had already been consumed upstream.
The practical rule is that total float is a property of a path and free float is a property of an activity. Free float is the part nobody else can claim, and it is the number to hand to a team as genuine breathing room. In this project only four activities have any: B with 2 days, F with 1, I with 7, and K with 22.
7. The critical path is not always critical
The critical path invites a comfortable conclusion: watch these eight activities and the project is under control. The path structure of this project shows why that is not enough.
There are five paths. The critical one runs 39 days. The next runs 38, through payments instead of the frontend. The third runs 37, through UI design instead of the database and API. Those two are not critical, but their float is one day and two days, which is less than the rounding error on most estimates.
This is what practitioners call the near-critical path problem, and it has a sharp consequence: a plan can have several paths that are all effectively critical, and a manager watching only the official one will be blindsided by a delay on a path that looked safe. Two days of float on a ten-day design task is not slack, it is noise.
The useful discipline is to rank paths by float rather than partitioning them into critical and not-critical. In this project the ranking 39, 38, 37, 32, 17 says something a red highlight cannot: three of the five paths need active management and two do not. Section 9 puts numbers on exactly how often each one ends up deciding the date.
8. PERT: putting a probability on the date
CPM assumes every duration is known. Nobody's durations are known. PERT, developed for the Polaris programme in 1959, addresses this by asking for three estimates per activity instead of one: an optimistic time a, a most likely time m, and a pessimistic time b.
From those it computes an expected duration and a variance for each activity:
te = (a + 4m + b) / 6 and σ² = ((b − a) / 6)²
The weights come from approximating each activity's duration with a beta distribution, which is flexible enough to be skewed and bounded at both ends, unlike a normal distribution which would allow negative durations. The formulas are approximations, and they were chosen partly because they were computable by hand in 1959.
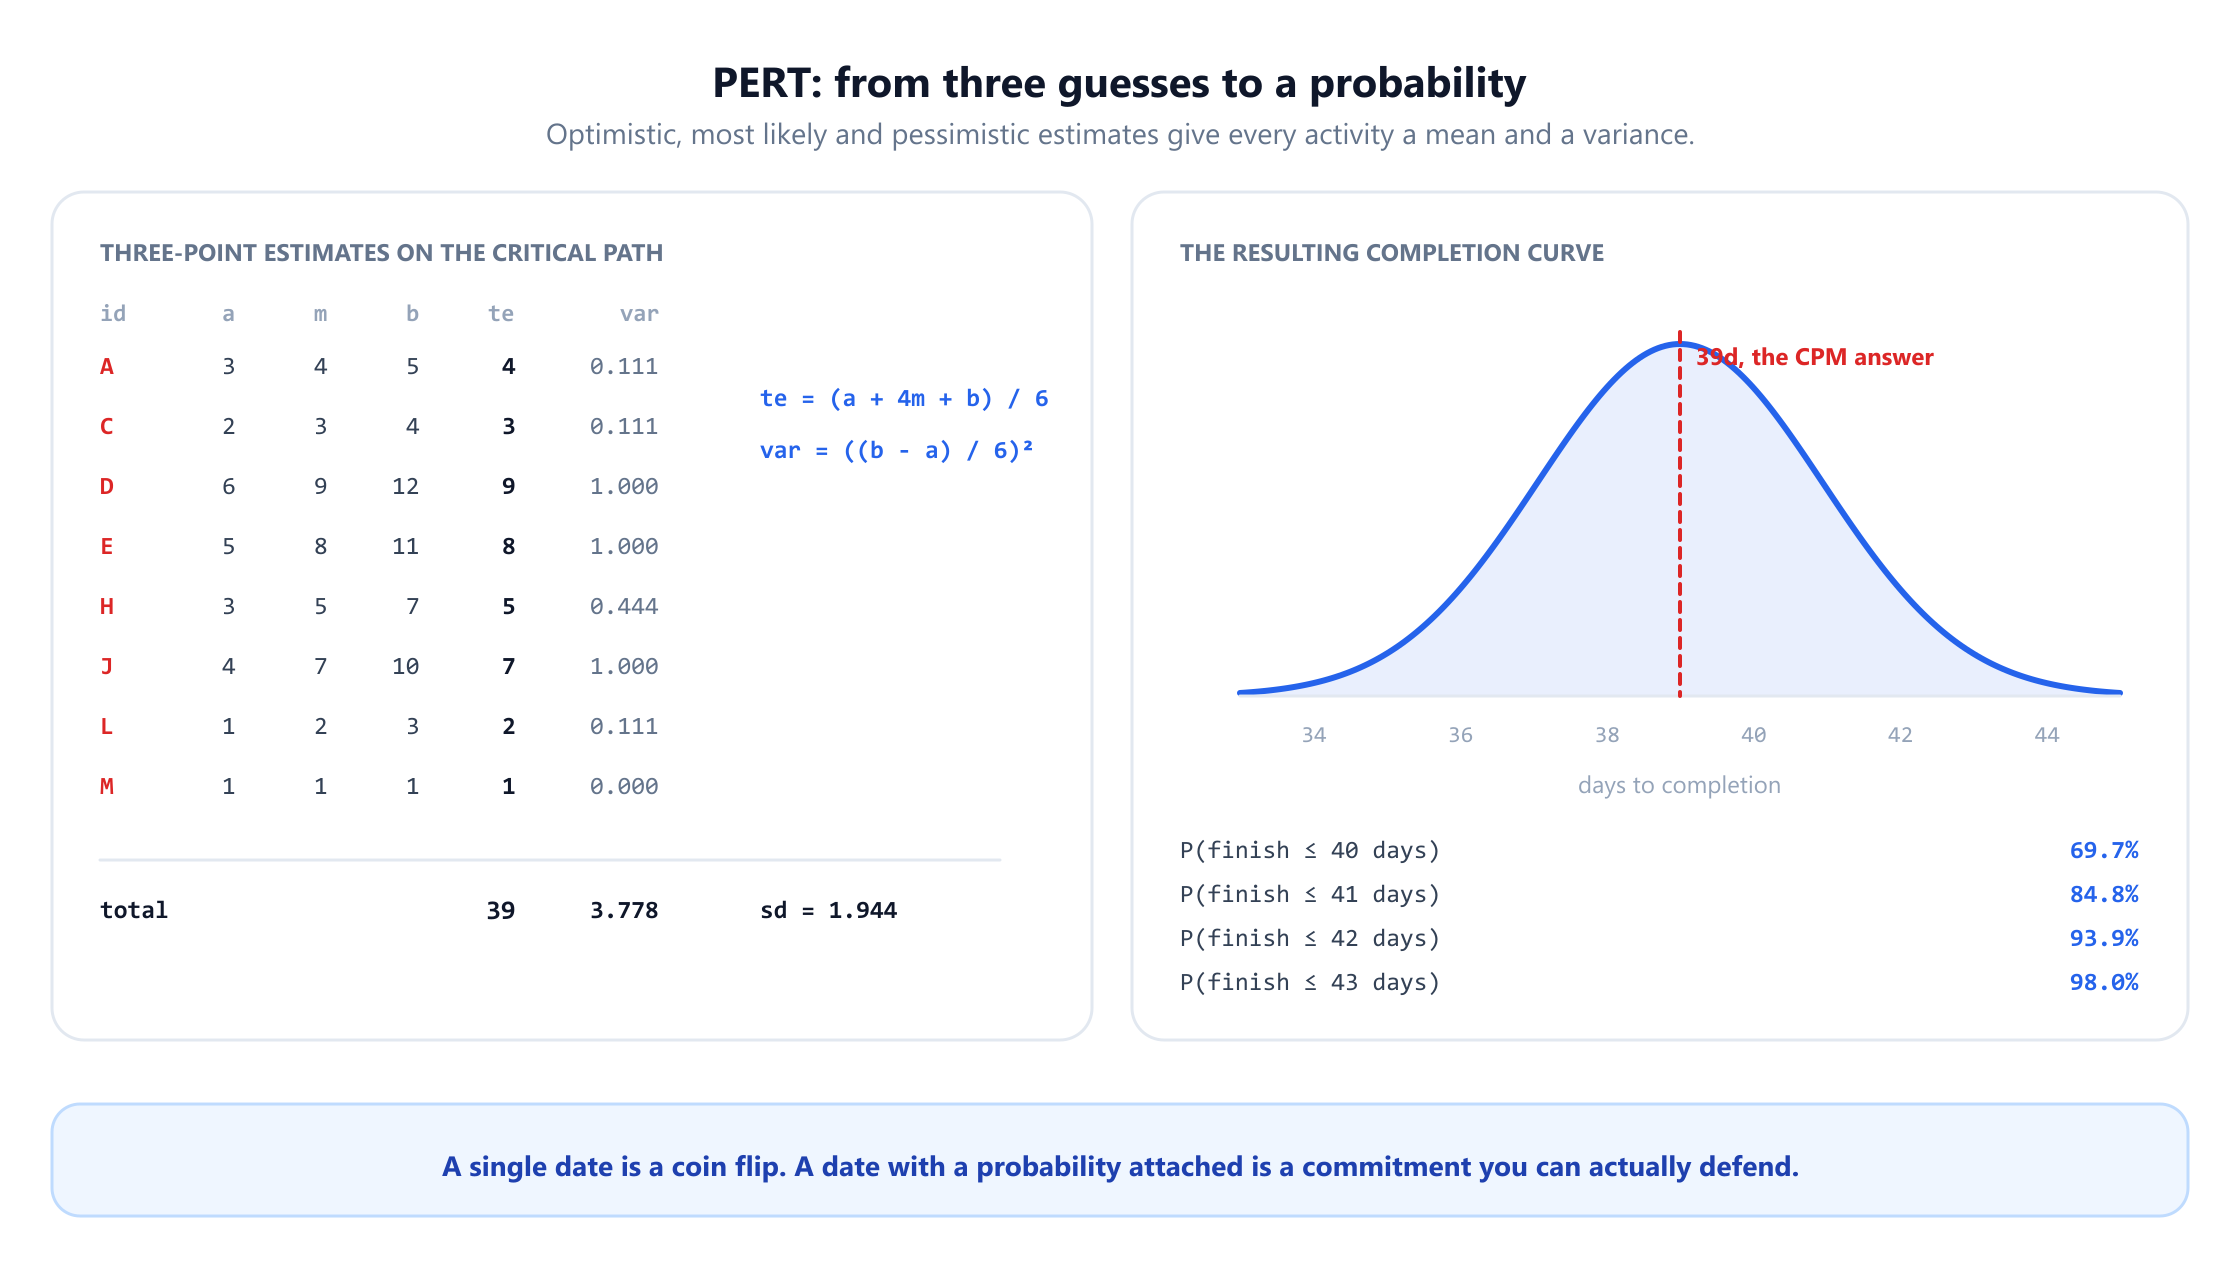
Summing along the critical path gives an expected project duration of 39 days with a total variance of 3.778, so a standard deviation of 1.944 days. The central limit theorem is then invoked: a sum of several independent activity durations is approximately normal even when the individual activities are not, which lets you read probabilities straight off the curve.
The result is far more useful than a date. Finishing within 40 days has probability 69.7%; within 41 days, 84.8%; within 42 days, 93.9%. Turned around: committing to 39 days is committing to a coin flip, buying three days of contingency raises confidence to about 94%, and a fourth day takes it to 98%.
The PERT visualizer performs this calculation interactively, including the completion probability for any target date. That reframing is the real contribution of PERT. A schedule that produces a single date invites the question "will we make it?", which has no honest answer. A schedule that produces a distribution invites "how much confidence do you want, and what will it cost?", which does.
9. The merge bias: why PERT is optimistic
PERT has a flaw, it was identified within a few years of publication, and it is still routinely ignored. The problem is that PERT computes the distribution of the critical path and then treats that as the distribution of the project. Those are not the same thing.
The project does not wait for the critical path. It waits for whichever path turns out to be longest on the day. When several paths converge on an activity, that activity starts when the slowest of them arrives, and the expected value of a maximum is greater than the maximum of the expected values. This is Jensen's inequality, and in project scheduling it is called the merge bias. Van Slyke demonstrated it by Monte Carlo simulation in 1963, and MacCrimmon and Ryavec analysed the size of the error in 1964.
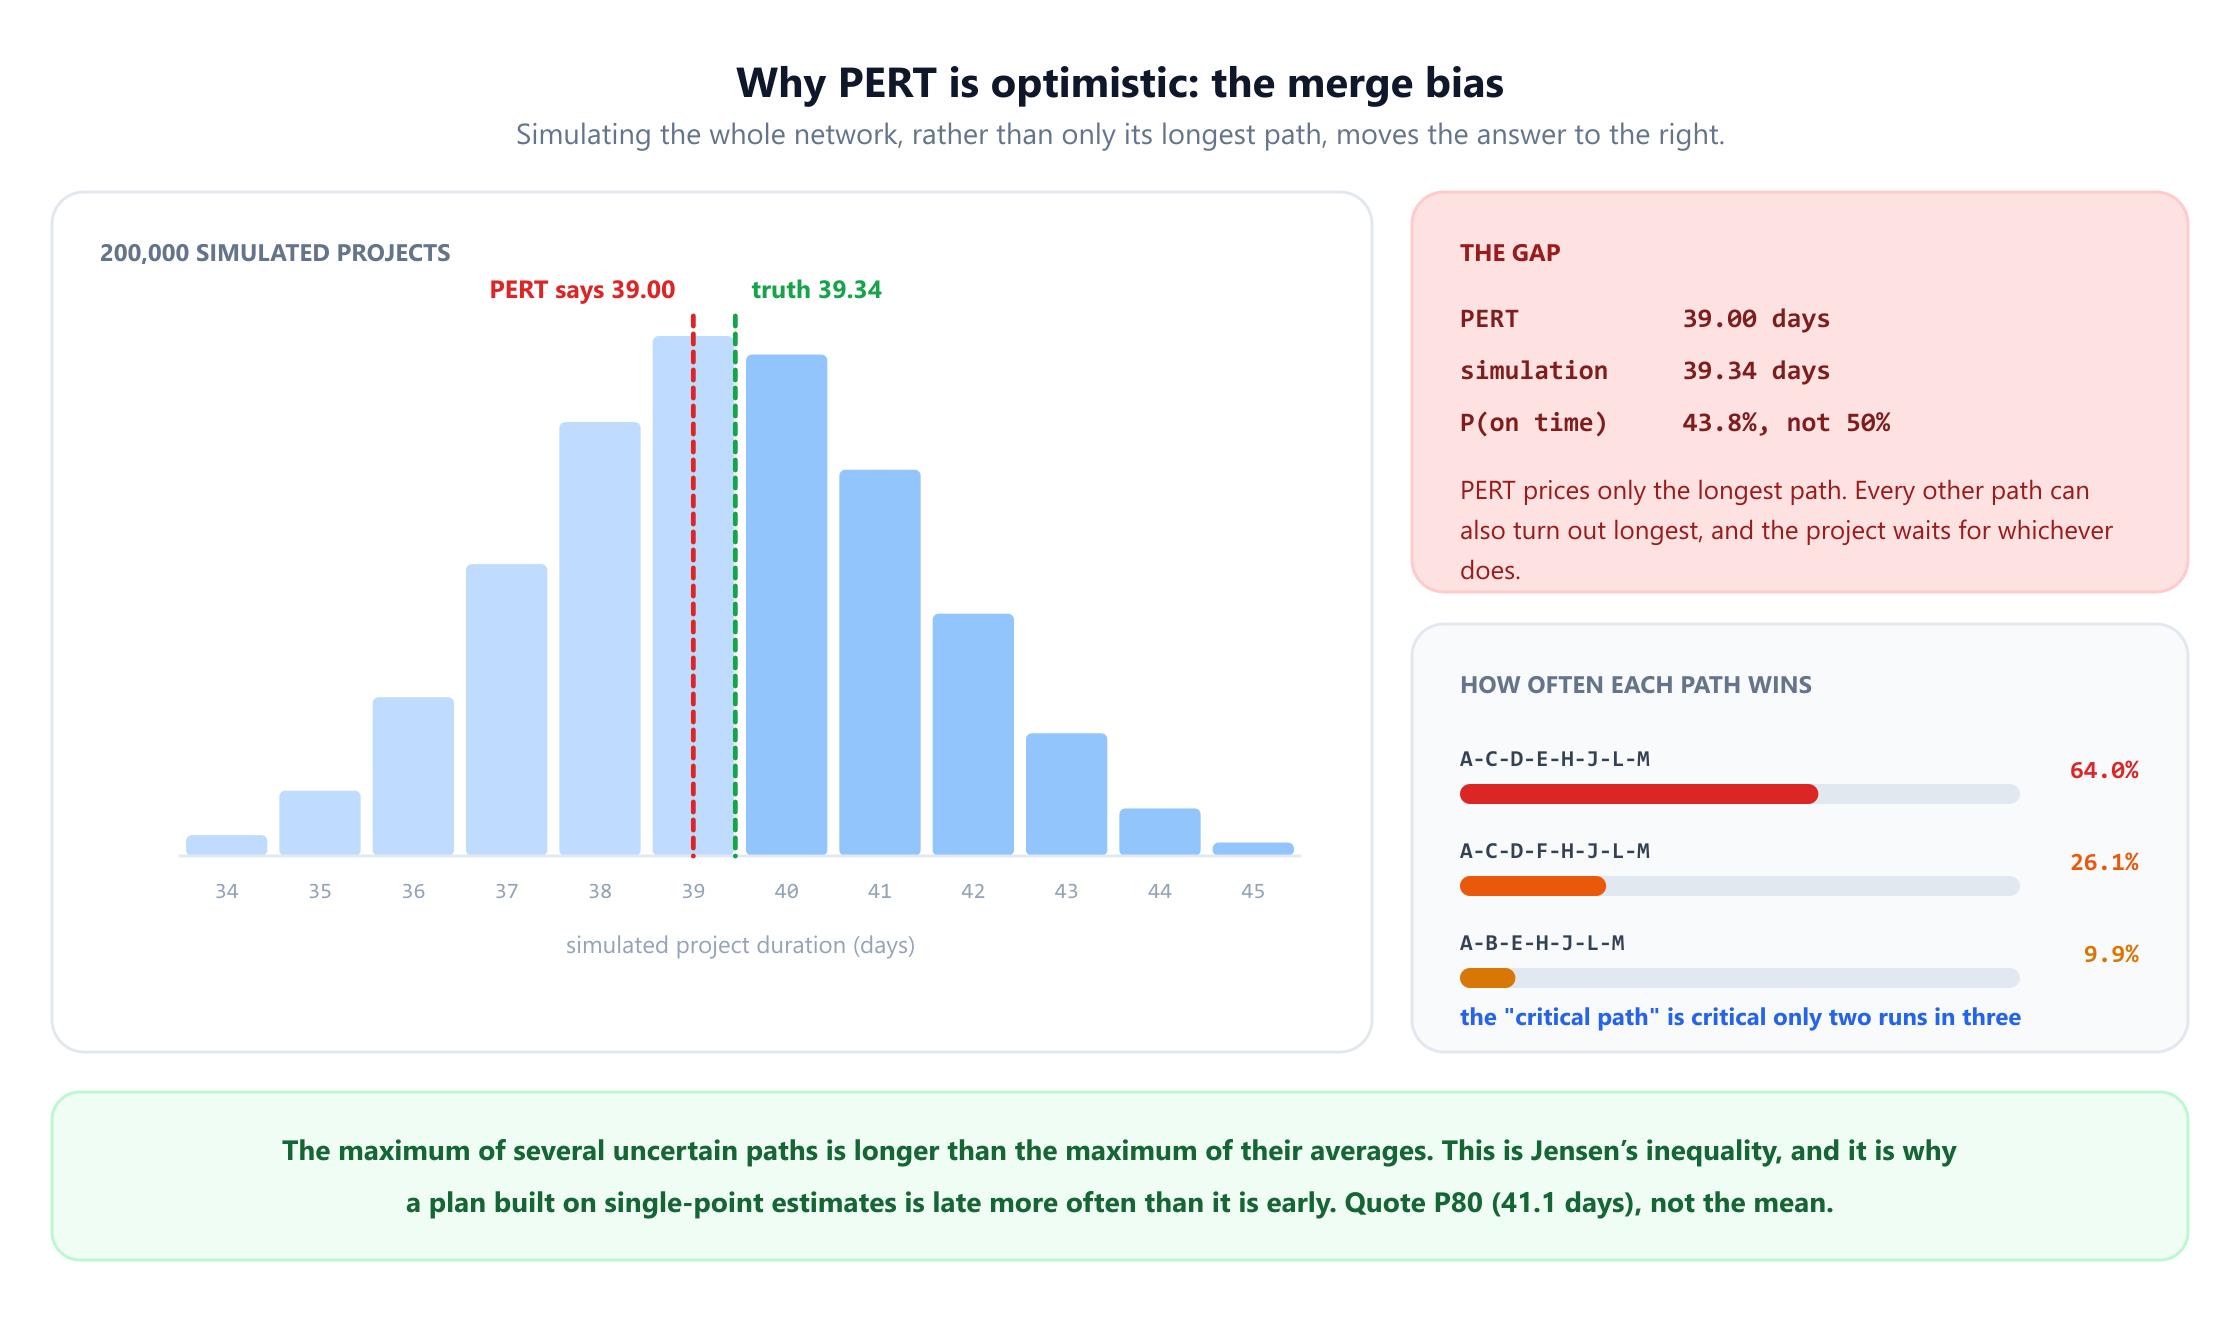
To measure it, every activity in this project was sampled 200,000 times from the beta distribution whose mean is exactly its PERT expected duration, so any difference in the result is the merge bias alone and not a different set of assumptions. The simulated mean duration is 39.34 days against PERT's 39.00. More usefully, the probability of finishing within 39 days is 43.8%, not the 50% PERT implies.
The path statistics explain where that comes from. Across the simulations the nominal critical path was the longest one in only 64.0% of runs. The payments path won 26.1% of the time, and the design path 9.9%. One project in three finishes late for a reason the critical path analysis never mentioned.
A third of a day of bias sounds negligible, and on this project it is. It is not negligible in general, and it grows in exactly the situations that describe large programmes: many parallel paths of similar length, many merge points, and high variance. A schedule with twenty near-equal paths converging on a milestone can be biased by weeks.
Two practical responses follow. First, if the network has significant parallelism, simulate it rather than propagating variance along one path; the computation is a few lines and takes seconds. Second, quote a percentile, not a mean. The P80 for this project is 41.1 days and the P90 is 42.0. Those are numbers a team can commit to. The mean is the number they will miss half the time, and slightly more than half once the merge bias is counted.
10. Crashing: buying time is a minimum cut
Suppose 39 days is too long. Many activities can be shortened by spending money: more people, overtime, a faster supplier. In scheduling this is called crashing, and each activity gets two extra numbers, the most days it can be shortened by and the cost per day, its cost slope.
The naive approach is to crash the cheapest critical activity. It works exactly once. The frontend build has the lowest slope on the critical path at $350 a day, so shortening it takes the project from 39 to 38 days for $350. The database schema is next at $400, taking it to 37.
Then the naive rule breaks. At 37 days, two paths are critical at the same time: the original one and the payments path, which now run to 37 days each. Shortening the frontend build again saves nothing, because payments would still run at full length and the project would still take 37 days. To gain a day you must shorten every critical path simultaneously.
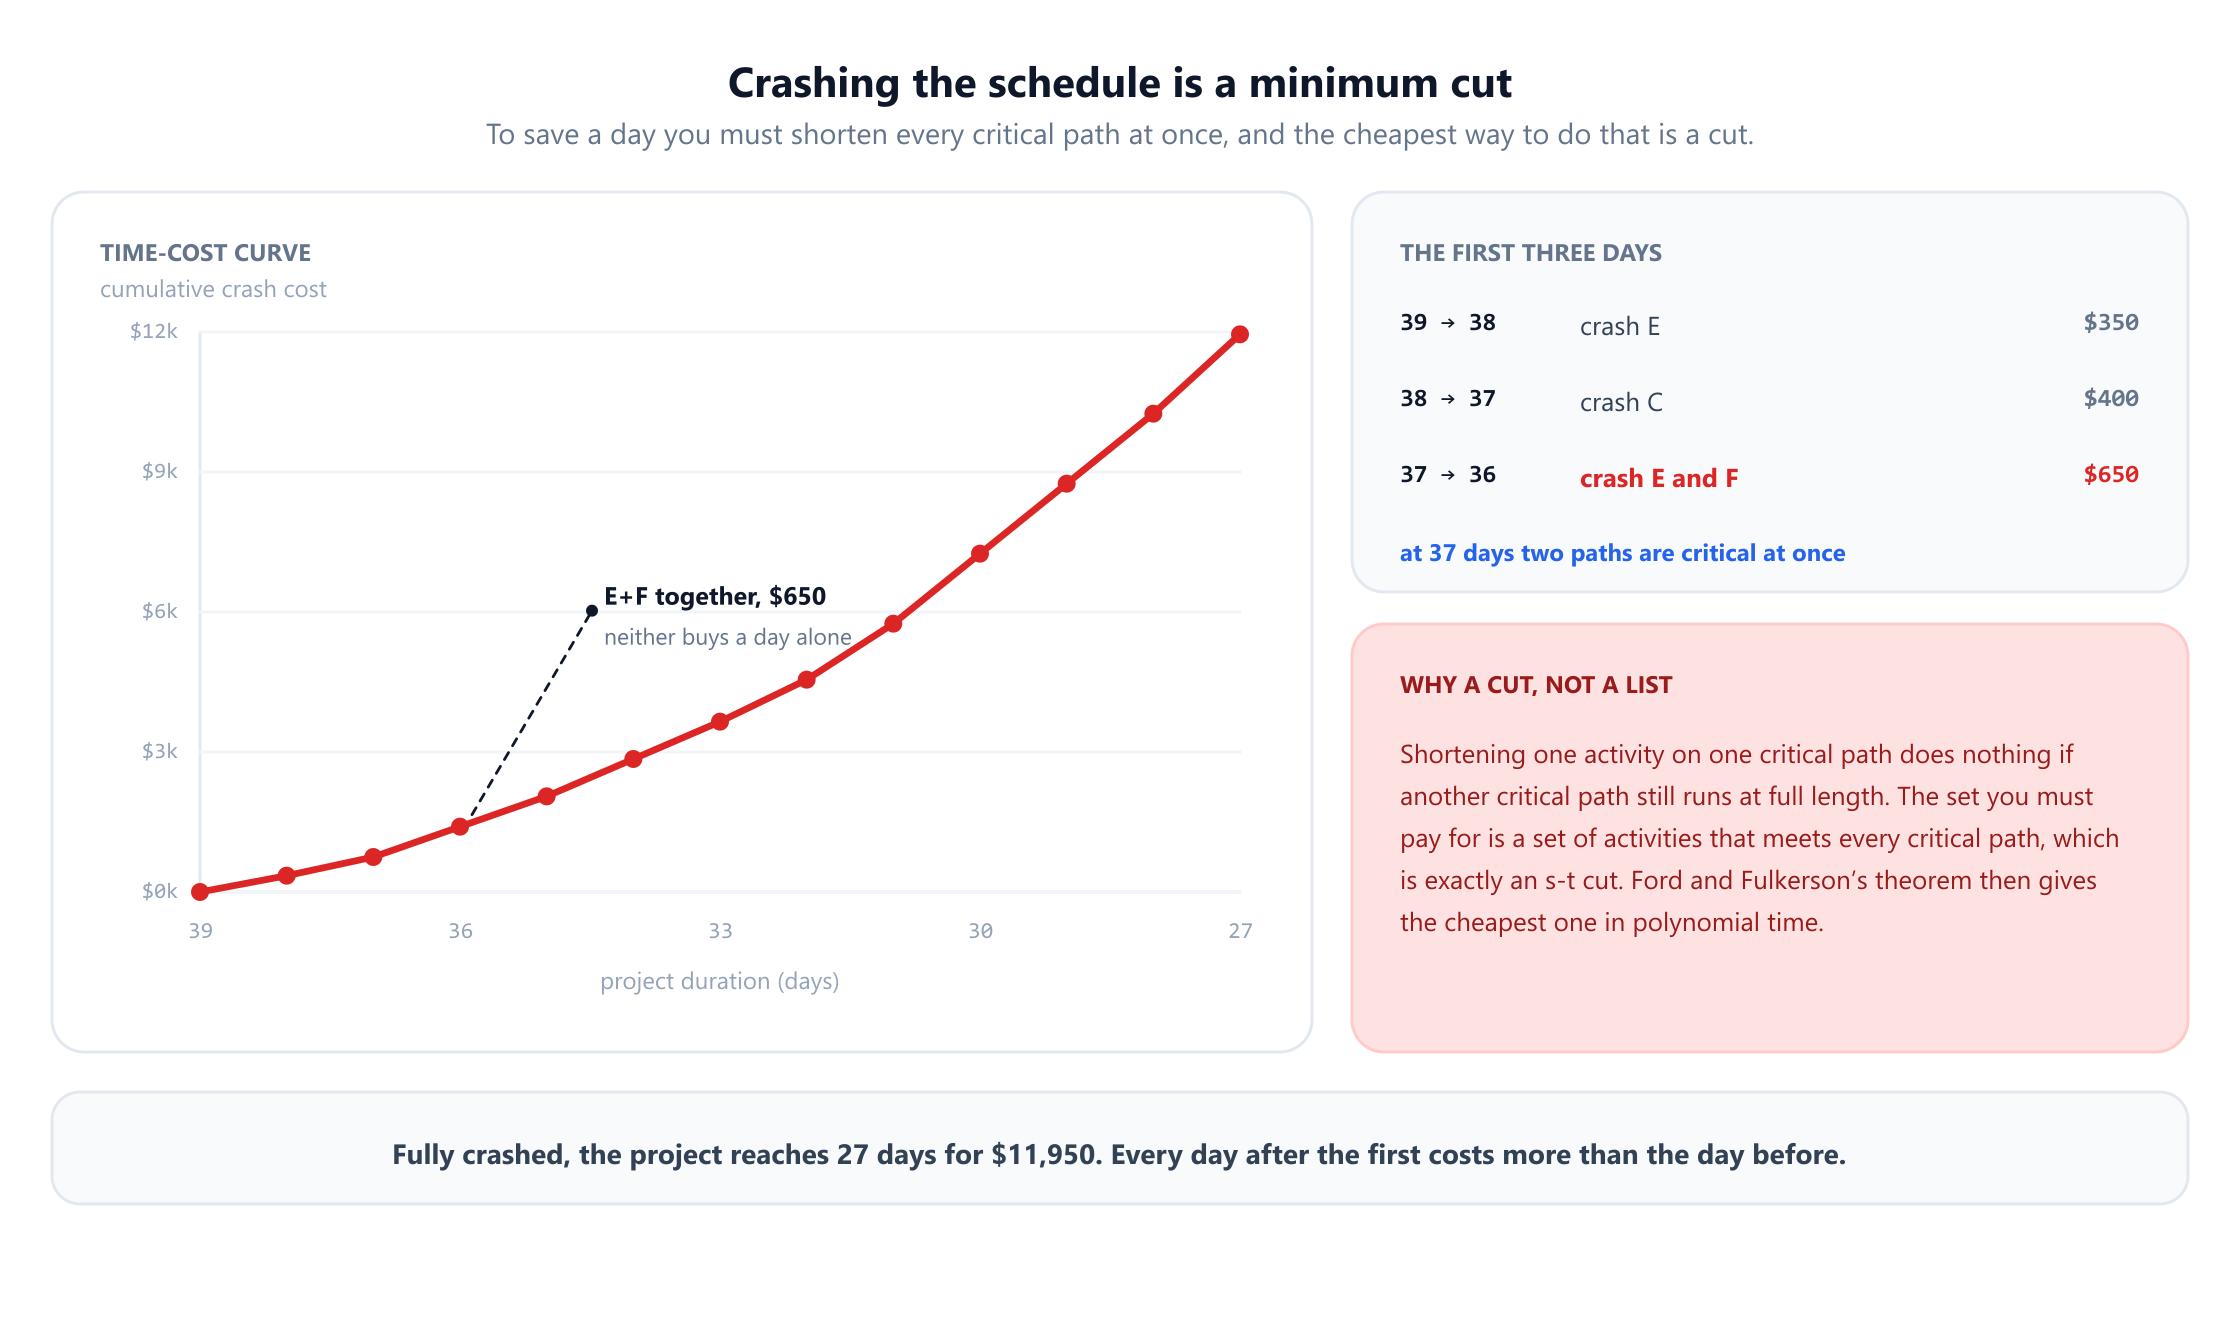
Here is the structure. A set of activities whose shortening reduces every critical path is a set that meets every path from the start of the project to its end within the critical subnetwork. That is the definition of an s-t cut. Give each activity a capacity equal to its cost per day, and the cheapest way to buy one day is the minimum cut of that network. By the max-flow min-cut theorem it can be found in polynomial time, which is the observation Fulkerson and Kelley both published in 1961.
If the flow argument is unfamiliar, the max-flow min-cut theorem is worth reading first, since crashing is one of its cleanest applications outside networking. Because activities are vertices rather than edges, each one is split into an in-copy and an out-copy joined by an arc carrying its cost slope, while the real dependencies get infinite capacity. The minimum cut then has to consist of activities, which is what you can actually buy.
Running this on the project gives the third step: going from 37 days to 36 costs $650, and it requires crashing the frontend build and payments together. Neither of them buys a day on its own, so no rule of the form "pick the cheapest critical task" would ever have found the pair. Integration testing does work alone, because it sits on both critical paths, but it costs $800 against the pair's $650.
Continuing to the limit produces the full time-cost curve: 27 days is the shortest achievable duration, at a total crash cost of $11,950. The curve is convex, meaning every extra day costs at least as much as the day before, which is a general property of this construction and a useful sanity check on any crashing analysis you are handed.
The curve, not the endpoint, is the deliverable. It converts an argument about whether the team can "go faster" into a price list: three days for $1,400, six days for $3,650, twelve days for $11,950. Whether any of those is worth paying is a business question, but it is now a question with numbers in it.
11. Resources: where the theory stops being enough
Everything so far assumes that if two activities can run in parallel, they do. That assumes unlimited people, and no project has unlimited people.
Give each activity a staffing requirement and look at the CPM schedule again. If everything starts as early as possible, demand on this project peaks at seven people from day nine to day fourteen, when the backend API, the UI design and the marketing site are all running. If the team has five people, the schedule is fiction.
Adding resource limits turns the precedence graph into the resource-constrained project scheduling problem (RCPSP), and the change in difficulty is not incremental. CPM is linear time. RCPSP is NP-hard, proved by Blazewicz, Lenstra and Rinnooy Kan in 1983, and it is hard in practice as well as in theory: instances with 60 activities in the standard PSPLIB benchmark library remained unsolved for years.
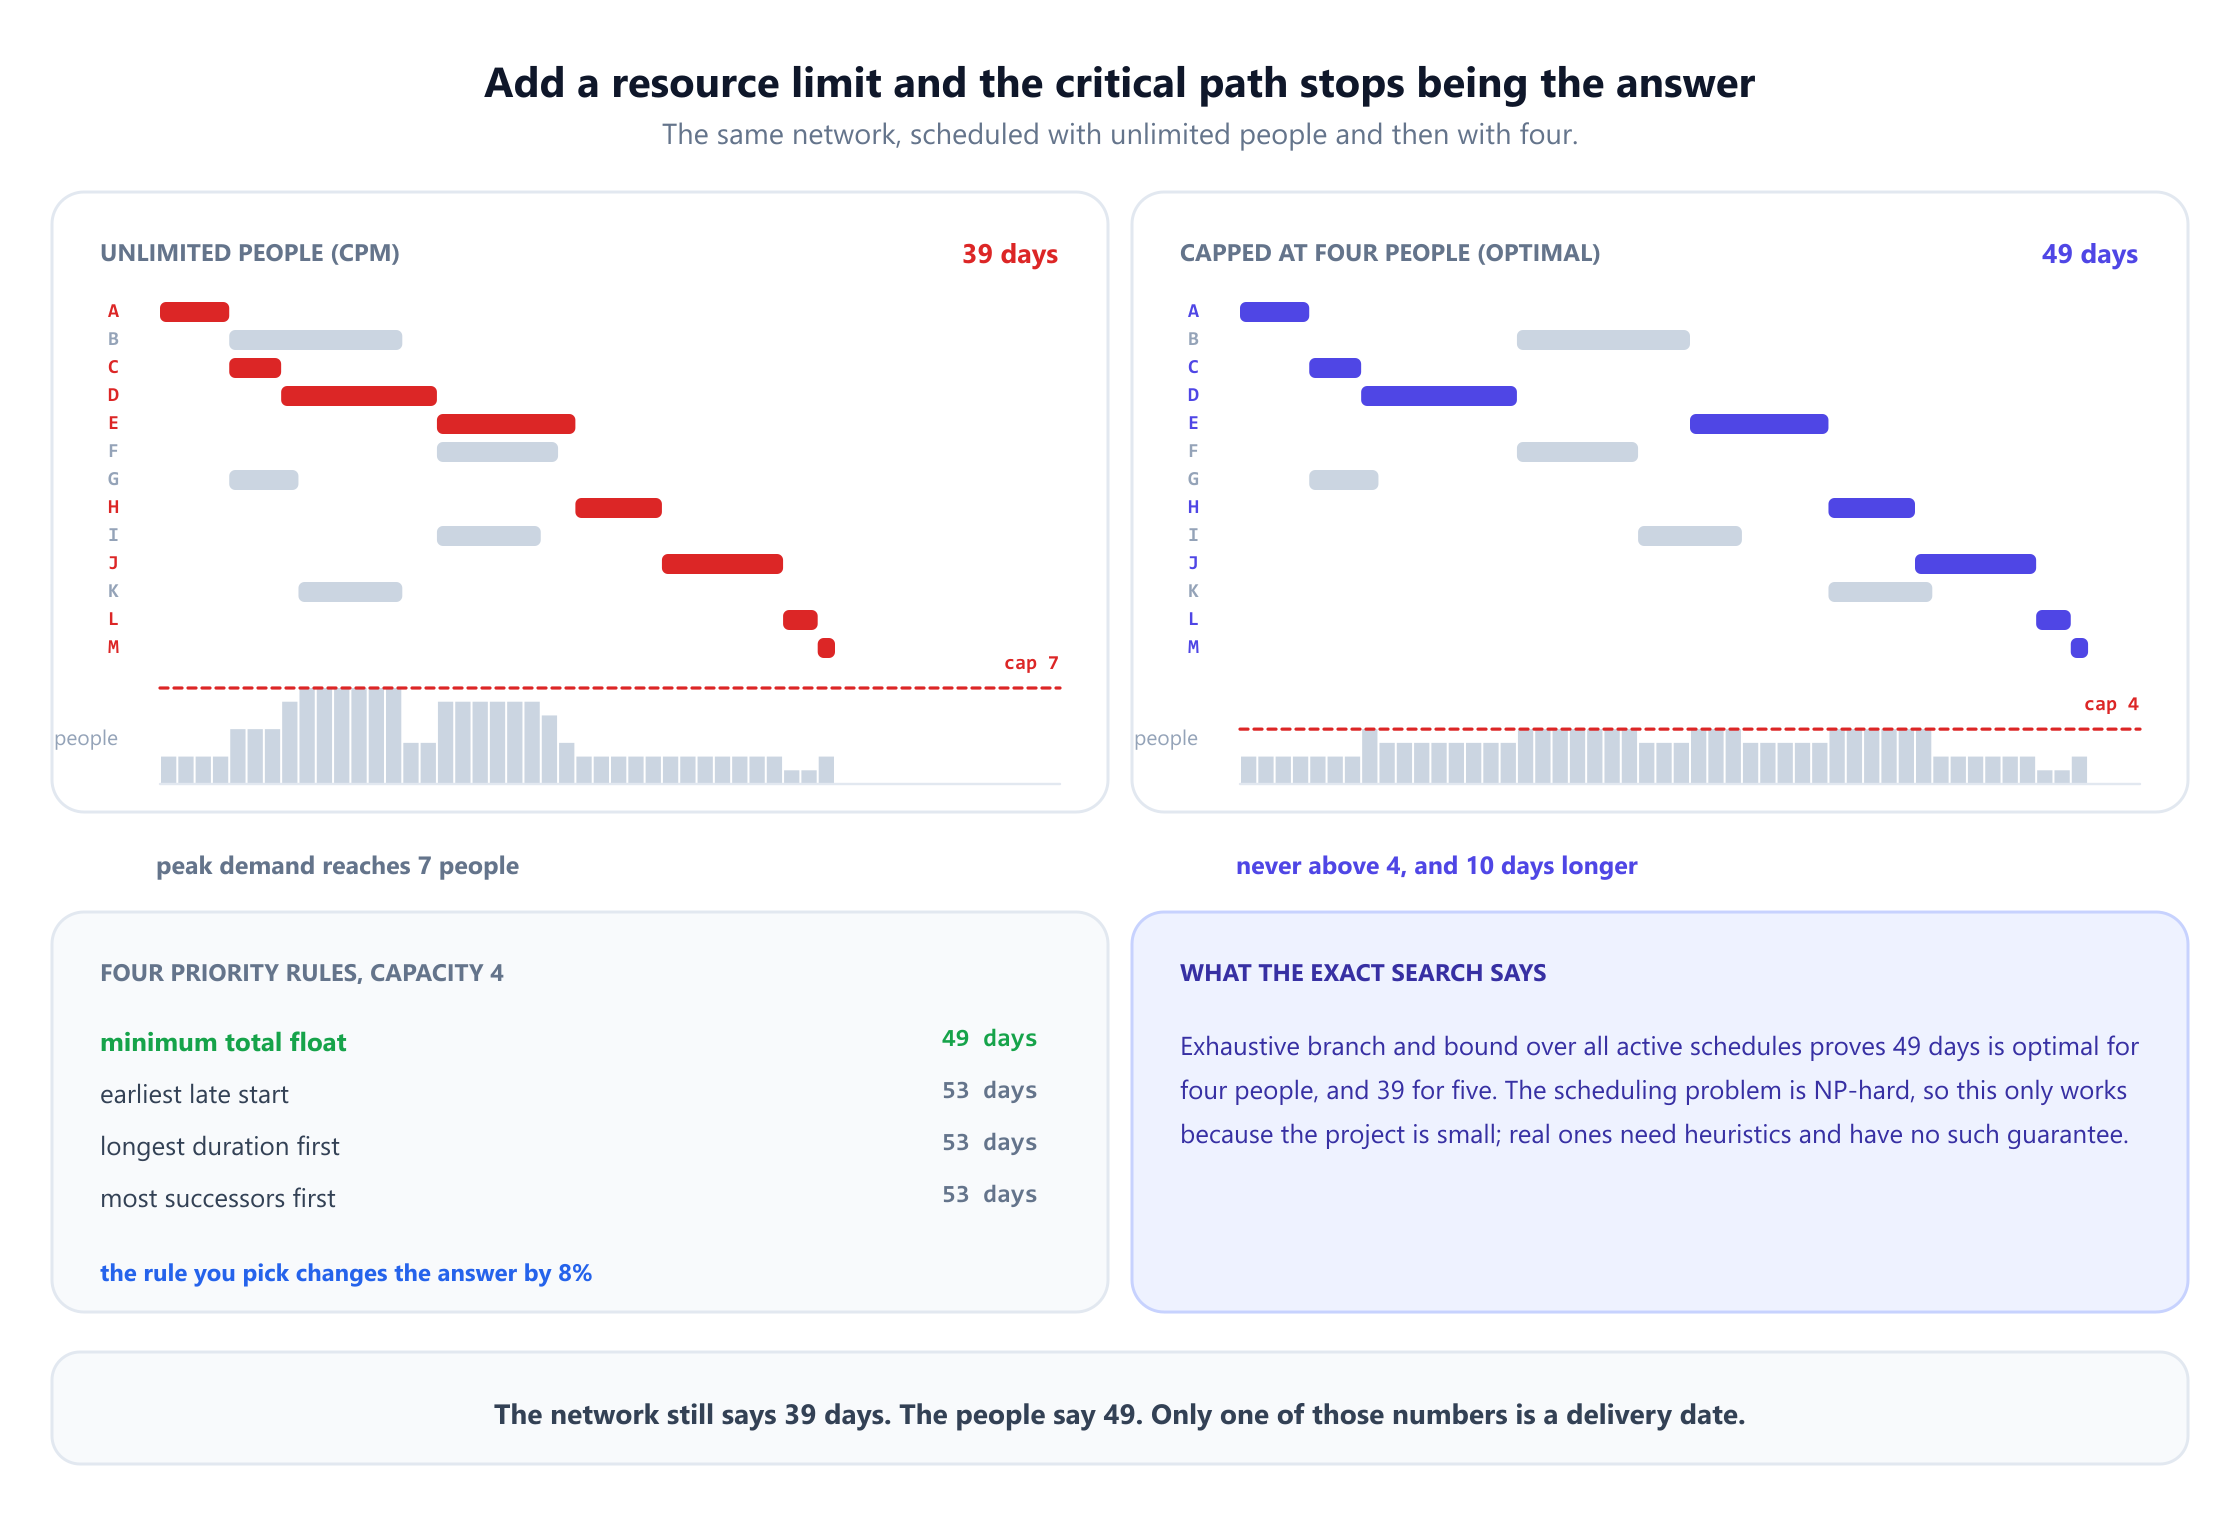
The numbers are worth sitting with. With five people the project still finishes in 39 days: the peak of seven was a scheduling artefact, and moving work into float absorbs it entirely. With four, the optimum is 49 days, a 26% overrun that appears nowhere in the network analysis. Both figures were verified by exhaustive branch and bound over all active schedules, which is feasible only because the project has thirteen activities.
The resource-constrained scheduling visualizer lets you set a capacity and watch the schedule stretch. Since exact solutions do not scale, practice uses priority rules: repeatedly schedule whichever eligible activity ranks highest under some rule. The choice of rule matters more than it looks. At capacity four, minimum total float gives 49 days, which happens to be optimal here, while earliest late start, longest duration first and most successors first all give 53. Same project, same constraint, an 8% difference from a modelling choice most tools make silently on your behalf.
The deeper point is that under resource constraints the critical path loses its meaning. Two activities with no dependency between them can still be unable to run together, so the chain that actually determines the end date may include pairs of activities linked by nothing but a shared person. The classical float numbers no longer describe what can slip.
12. Critical chain, briefly
That observation is the starting point of critical chain project management, introduced by Eliyahu Goldratt in 1997. The critical chain is the longest sequence of activities accounting for both precedence and resource contention, which is the right object to watch when people are scarce.
Its second idea concerns where safety time is kept. Individual estimates are usually padded, and the padding is then consumed regardless, whether through work expanding to fill the time available or through a comfortable start date being taken up. Critical chain strips the padding from individual activities and pools it into explicit buffers: a project buffer at the end of the chain, and feeding buffers where non-critical paths merge into it. Pooling is statistically sound, though for a different reason from the merge bias: the standard deviation of a sum of independent durations grows like the square root of how many there are, so one shared buffer can be smaller than the individual margins it replaces and still give the same protection.
The method is genuinely contested. Herroelen and Leus, among others, have argued that its scheduling claims are weaker than presented and that buffer sizing rules such as "half the chain length" have no analytical basis. The buffer-pooling insight is sound; the surrounding framework is a management method rather than a theorem, and it is worth keeping the two apart.
13. What is easy, what is hard
Project scheduling has an unusually sharp complexity boundary, and knowing where it falls tells you which promises a tool can keep.
Easy, meaning polynomial and instant at any realistic size. Detecting cycles and producing a topological order. The forward and backward pass, and therefore the project duration, the critical path, and every float value. Enumerating the paths that matter by float. The minimum cut for one day of crashing, and the whole time-cost curve by repeating it. Monte Carlo simulation of the duration distribution. All of this is linear or near-linear, and a project with a hundred thousand activities is not a problem.
Hard, meaning NP-hard with no polynomial algorithm expected. Scheduling under resource constraints, in essentially every variant: fixed capacity, multiple resource types, preemption allowed or not. Resource levelling, which asks for the smoothest profile rather than the shortest schedule. Time-cost tradeoffs with discrete options per activity rather than a continuous slope, which loses the flow formulation. Enumerating all paths, which can grow exponentially with the number of activities.
The pattern is close to a rule of thumb: asking for one optimal schedule in time alone is easy, and adding a shared limited resource makes it hard. The two exceptions in the hard list prove the rule rather than break it, since neither asks for a single optimum: path enumeration asks for every answer, and the discrete tradeoff asks for a choice from a menu at each activity. Time constraints are a partial order, and partial orders are what directed acyclic graphs handle well. A shared resource creates constraints between activities with no dependency between them, and the acyclic structure that made everything tractable no longer describes the problem.
Which is why scheduling software gives an exact critical path and an approximate resource-levelled plan, usually without saying so. The first is a theorem; the second is a heuristic whose quality nobody reports. This is one corner of a much larger field: operations research covers the optimisation methods that the harder half of this list needs.
14. Modelling mistakes and how to avoid them
Five errors account for most bad schedules, and none of them is about estimating badly.
Treating float as a buffer you own. Total float is shared along a path. Two teams each told they have three weeks of slack, on the same path, will between them consume six and be surprised when the date moves. Report free float to teams and keep total float as a planning number.
Watching only the critical path. A path with two days of float is not safe, it is nearly critical, and on this project the nominal critical path decides the outcome only two runs in three. Rank paths by float and manage everything within a few days of zero.
Quoting the mean as the date. The expected duration is roughly a coin flip even before the merge bias, and slightly worse after it. If a date is going into a contract, it should be a percentile, and the percentile should be stated.
Assuming independence. Both PERT's variance sum and the simulation in section 9 assume activity durations are independent. They are usually not: the same optimistic estimator produced several of them, the same team runs several of them, and one bad supplier affects several at once. Correlation inflates the variance of the total well beyond what either method reports, so treat the spread as a floor rather than an estimate.
Planning as though people were unlimited. A CPM date computed without resource limits is a lower bound, not a plan. Check the resource profile before publishing the date; on this project the difference between checking and not checking was ten days.
A sixth deserves a mention because it is invisible: a dependency that is not real. Plans accumulate constraints added for comfort, sequencing that reflects how the team happens to be organised rather than anything technical. Adding an edge can only lengthen the longest path or leave it where it is, never shorten it, so every unnecessary dependency is a one-way bet against the schedule. Auditing the critical path edge by edge, asking whether each one is a genuine constraint, is often the cheapest schedule compression available, and unlike crashing it costs nothing.
15. Frequently asked questions
How is graph theory used in project management?
+
A project plan is a directed acyclic graph: activities are vertices, dependencies are directed edges, and durations are weights. Once it is written that way, the standard questions become standard algorithms. Topological sorting checks whether the plan can be executed at all. A longest-path computation gives the project duration and the critical path. The gap between the forward and backward pass gives float. A minimum cut gives the cheapest way to shorten the schedule. Adding resource limits turns it into the resource-constrained project scheduling problem, which is NP-hard.
What is the critical path, exactly?
+
The longest path from the start of the project to its end, measured in duration rather than number of activities. Its length is the project duration, because every activity on it must happen in sequence and nothing can compress that. Equivalently it is the set of activities whose total float is zero, which is what the forward and backward pass computes. On the project in this article it is A-C-D-E-H-J-L-M at 39 working days. Delaying any activity on it delays the whole project by the same amount, and speeding up any activity off it changes the end date by nothing.
What is the difference between total float and free float?
+
Total float is how long an activity can slip before the project end date moves. Free float is how long it can slip before any of its successors has to start later. The difference matters because total float is shared along a path rather than owned by an activity. In this project content and the marketing site each show 22 days of total float, but their path holds 22 days in total, once. Spend all of it on content and the marketing site drops to zero float immediately. Free float is the part nobody else can claim, so it is the number to give a team.
What is the difference between CPM and PERT?
+
Both compute the longest path through the same kind of network, and both were published in 1959. CPM, from Kelley and Walker at DuPont and Remington Rand, assumes each duration is a single known number and adds a cost dimension, which is where crashing comes from. PERT, from the US Navy's Polaris programme, assumes durations are uncertain and asks for three estimates per activity, an optimistic, a most likely and a pessimistic one, then derives an expected duration and a variance so the completion date can be quoted as a probability. In modern tools the two are blended and the distinction is mostly historical.
Why is PERT optimistic, and what is the merge bias?
+
Because PERT computes the distribution of the critical path and then treats it as the distribution of the project. The project actually waits for whichever path is longest on the day, and the expected value of a maximum exceeds the maximum of the expected values, which is Jensen's inequality. Simulating this project 200,000 times gives a mean of 39.34 days against PERT's 39.00, and the chance of finishing within 39 days is 43.8% rather than the 50% PERT implies. The nominal critical path was the longest one in only 64.0% of runs. The bias grows with the number of near-equal parallel paths.
Why is crashing a schedule a minimum cut problem?
+
Because to shorten the project by one day you must shorten every critical path by one day, so the set of activities you pay to crash has to meet all of them. A set that meets every path from the start to the end is an s-t cut, and if each activity's arc carries its cost per day, the cheapest such set is the minimum cut, computable in polynomial time by max-flow min-cut. Fulkerson and Kelley both published this in 1961. It matters because the answer is often not the cheapest activity: on this project the third day costs $650 and requires crashing the frontend build and payments together.
Why do resource limits make scheduling so much harder?
+
Because precedence constraints form a partial order, which a directed acyclic graph handles in linear time, while a shared resource creates constraints between activities that have no dependency between them at all. That destroys the structure the whole method relies on. The resource-constrained project scheduling problem is NP-hard, proved by Blazewicz, Lenstra and Rinnooy Kan in 1983. On this project the unconstrained answer is 39 days with a peak demand of seven people; with four people the true optimum is 49 days, and under resource limits the critical path stops describing what can slip.
Should I commit to the expected duration or a percentile?
+
A percentile, and you should say which one. The expected duration is by construction about a coin flip, and the merge bias pushes it slightly worse than that: on this project the chance of finishing within the expected 39 days is 43.8%. The P80 is 41.1 days and the P90 is 42.0 days, so roughly two days of contingency moves a promise from an even chance to a comfortable one. Quoting a percentile also changes the conversation from whether the team will make it, which has no honest answer, to how much confidence is wanted and what it costs, which does.
16. References
The papers behind the methods in this article, in chronological order.
- Clark, W. (1922). The Gantt Chart: A Working Tool of Management. Ronald Press.
- Kelley, J. E. and Walker, M. R. (1959). “Critical-path planning and scheduling.” Proceedings of the Eastern Joint Computer Conference, 160–173.
- Malcolm, D. G., Roseboom, J. H., Clark, C. E. and Fazar, W. (1959). “Application of a technique for research and development program evaluation.” Operations Research, 7(5), 646–669.
- Fulkerson, D. R. (1961). “A network flow computation for project cost curves.” Management Science, 7(2), 167–178.
- Kelley, J. E. (1961). “Critical-path planning and scheduling: mathematical basis.” Operations Research, 9(3), 296–320.
- Ford, L. R. and Fulkerson, D. R. (1962). Flows in Networks. Princeton University Press.
- Van Slyke, R. M. (1963). “Monte Carlo methods and the PERT problem.” Operations Research, 11(5), 839–860.
- MacCrimmon, K. R. and Ryavec, C. A. (1964). “An analytical study of the PERT assumptions.” Operations Research, 12(1), 16–37.
- Klingel, A. R. (1966). “Bias in PERT project completion time calculations for a real network.” Management Science, 13(4), B194–B201.
- Wiest, J. D. (1967). “A heuristic model for scheduling large projects with limited resources.” Management Science, 13(6), B359–B377.
- Elmaghraby, S. E. (1977). Activity Networks: Project Planning and Control by Network Models. Wiley.
- Blazewicz, J., Lenstra, J. K. and Rinnooy Kan, A. H. G. (1983). “Scheduling subject to resource constraints: classification and complexity.” Discrete Applied Mathematics, 5(1), 11–24.
- Kolisch, R. and Sprecher, A. (1997). “PSPLIB: a project scheduling problem library.” European Journal of Operational Research, 96(1), 205–216.
- Goldratt, E. M. (1997). Critical Chain. North River Press.
- Brucker, P., Drexl, A., Möhring, R., Neumann, K. and Pesch, E. (1999). “Resource-constrained project scheduling: notation, classification, models, and methods.” European Journal of Operational Research, 112(1), 3–41.
- Herroelen, W. and Leus, R. (2001). “On the merits and pitfalls of critical chain scheduling.” Journal of Operations Management, 19(5), 559–577.
- Demeulemeester, E. and Herroelen, W. (2002). Project Scheduling: A Research Handbook. Kluwer Academic Publishers.
- Herroelen, W. and Leus, R. (2005). “Project scheduling under uncertainty: survey and research potentials.” European Journal of Operational Research, 165(2), 289–306.
- Kolisch, R. and Hartmann, S. (2006). “Experimental investigation of heuristics for resource-constrained project scheduling: an update.” European Journal of Operational Research, 174(1), 23–37.
- Hartmann, S. and Briskorn, D. (2010). “A survey of variants and extensions of the resource-constrained project scheduling problem.” European Journal of Operational Research, 207(1), 1–14.
- Trietsch, D. and Baker, K. R. (2012). “PERT 21: fitting PERT/CPM for use in the 21st century.” International Journal of Project Management, 30(4), 490–502.